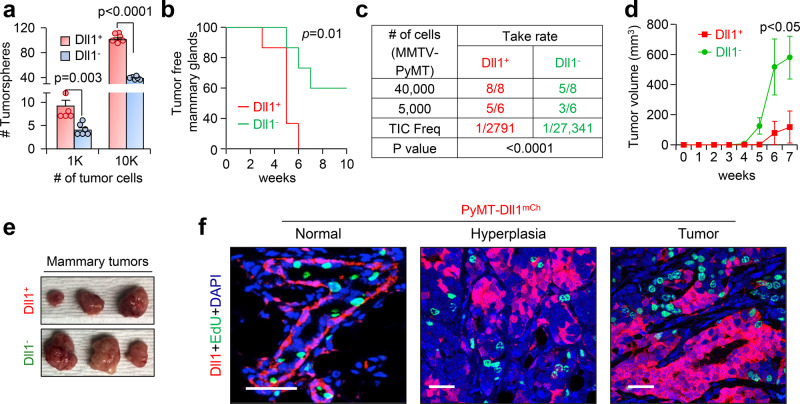
Fig. 3. Dll1+ cells are quiescent TICs and are highly metastatic compared to Dll1− tumor cells.
a A bar graph depicts the number of total tumorspheres from single sorted Dll1+ and Dll1− tumor cells. Single cells were cultured in the low adherent plates for seven days in tumorsphere media80 (n = 6 wells per group). b–f Dll1+ (mCherry+) and Dll1− (mCherry−) tumor cells isolated from PyMT-Dll1mCh spontaneous tumors were injected into the mammary fat pad (MFP) of C57BL/6 mice. Contralateral mammary glands (4th position) were used for MFP injection, n is indicated in the table. b The KM-plot depicts the tumor initiation capacities of PyMT-Dll1+ and PyMT-Dll1− tumor cells. The tumors were considered initiated when tumors grew bigger than 1 × 1 mm in dimension. c The table shows the tumor-forming potential of PyMT-Dll1+ and PyMT-Dll1− tumor cells upon transplantation into C57BL/6 mice. d, e Representative growth curves and images from c show that Dll1− tumors grew faster than Dll1+ tumor cells (n = 5 Dll1− and n = 8 Dll1+ tumors). f Representative IF images illustrate Dll1+ cells (mCherry) do not colocalize with EdU+ proliferating cells (green) in the normal mammary gland, hyperplasia, and tumor of PyMT-Dll1mCh mice. mCherry antibody was used to detect Dll1mCh+ cells. Two-way ANOVA with Bonferroni post-test adjustment a, d, two-tailed Log-Rank test b and Chi-square test c were used to calculate P values. f The IF was done twice using tumors (n = 3 samples/groups) from three independent experiments. a, d Data are presented as the mean ± SEM. Scale bars, 40 µm (f). Source data are provided as a source data file.

