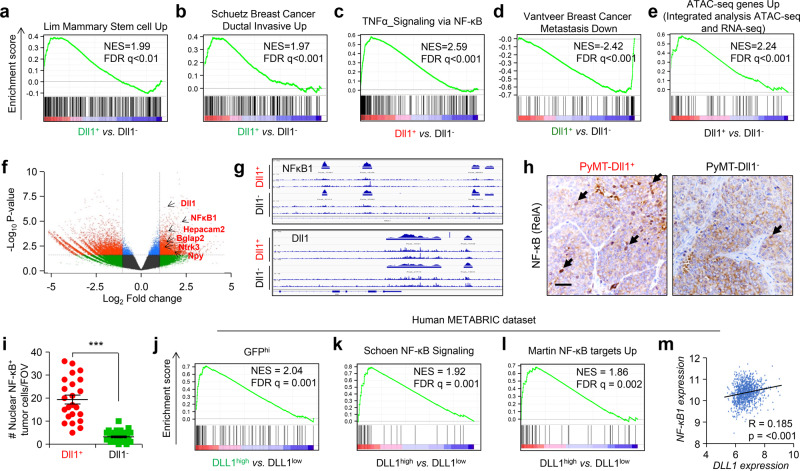
Fig. 4. RNA-seq and ATAC-seq shows that Dll1+ tumor cells have enriched signatures for NF-κB pathway.
a–e We isolated Lin− Dll1+ and Dll1− tumor cells from either PyMT-Dll1GFP (Green color) or PyMT-Dll1mCh (Red color) tumors and performed a RNA-seq analysis. Geneset enrichment analyses (GSEA) demonstrate increased mammary stem cell a, increased invasiveness b, increased NF-κB signaling c and increased metastasis d signatures in Dll1+ tumor cells compared to Dll1− tumor cells. e Genes with a proximal ATAC-seq peak increasing significantly at p < 0.05 in Dll1+ cells show enrichment in the GFP/mCherry UP (Dll1+) combined RNA-seq ranked list. f Volcano plot from ATAC-seq analysis depicts enriched peaks for several protumorigenic and prometastatic genes in Dll1+ tumor cells compared to Dll1− cells. g NF-kB1 and Dll1 showed several open chromatin enriched peaks in Dll1+ tumor cells compared with Dll1− tumor cells. h–i Representative IHC images show higher nuclear NF-kB+ tumors cells in Dll1+ compared with Dll1− tumors. Cell sorting was performed to enrich for these population followed by mammary fat pad injection. The dots in scatter plot represents the FOV, which is obtained from n = 3 tumors per group. FOV is field of view. Black arrows indicate nuclear staining of NF-κB in tumor cells. j GSEA analysis of GFP+ tumor cells show enrichment of Dll1+ mouse tumor genes to genes of DLL1high luminal A and B patients (top 100 genes). k, l GSEA analyses show NF-κB signatures up in DLL1high luminal A and B patients compared with DLL1low luminal A and B patients. m Correlation plot depict a positive correlation between NF-κB1 and DLL1 expression in luminal A and B patient samples. j–m DLL1high and DLL1low patient data was obtained from METABRIC dataset (n = 1140 patient tumors). PyMT-Dll1mCh model was used for both RNA-seq and ATCT-seq whereas PyMT-Dll1GFP was used only for RNA-seq (n = 2 Dll1+ and n = 2 Dll1− Lin− tumor cells from PyMT-Dll1mCh tumors for RNA-seq were used; n = 2 Dll1+ and n = 2 Dll1− Lin− tumor cells from PyMT-Dll1GFP tumors for RNA-seq were used; and n = 4 Dll1− and n = 3 Dll1+ Lin− tumor cells isolated from PyMT-Dll1mCh tumors for ATAC-seq). Two-tailed unpaired Student’s t-test (i) and pearson correlation coefficient m were used to calculate P values. i Data are presented as the mean ± SEM. Scale bar, 60 μm h. Source data are provided as a source data file.

