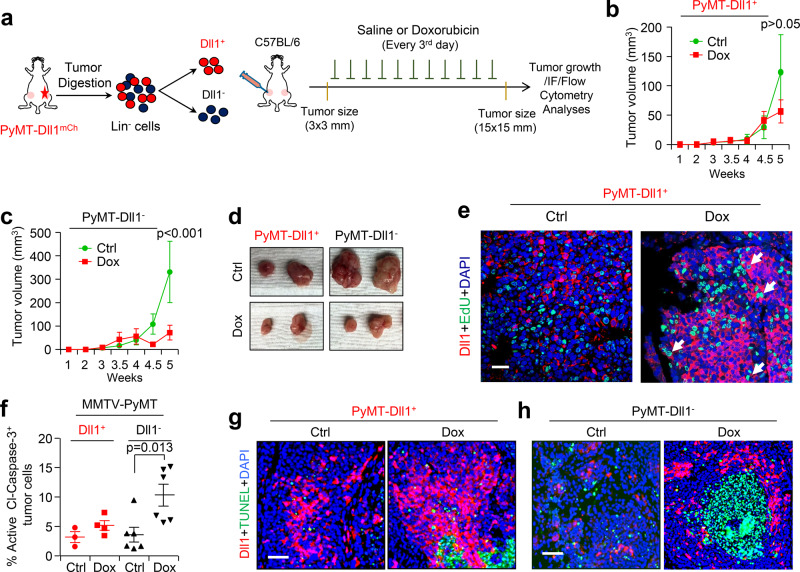
Fig. 5. Dll1+ tumor cells are chemoresistant in PyMT tumors.
a Schematic shows the experimental plan of in vivo doxorubicin sensitivity assays using PyMT-Dll1+ and PyMT-Dll1− tumors. b, c Tumor growth curves show PyMT-Dll1+ b and PyMT-Dll1− c tumor growths upon saline (ctrl) or doxorubicin treatments. d Representative whole tumor images from b, c. b–d n = 6 tumors/group. e The representative IF images show the expression of Dll1 (Red) and EdU+ proliferating cells (Green) in PyMT-Dll1+ tumors upon treatment of saline or doxorubicin. mCherry antibody was used to detect Dll1mCh+ cells. The white arrows indicate proliferating Dll1+ EdU+ tumor cells upon doxorubicin treatment. f The flow cytometry data demonstrate the percentage of active cleaved-caspase-3 positive cells in PyMT-Dll1+ and PyMT-Dll1− tumors treated with either saline (ctrl) or doxorubicin. g, h The representative IF images show the expression of Dll1 (Red) and TUNEL+ apoptotic cells (Green) in PyMT-Dll1+ g and PyMT-Dll1− h tumors upon treatment of saline or doxorubicin. The formalin-fixed tumors specimen were stained with the mCherry antibody to detect Dll1+ tumor cells. P values were calculated using two-way ANOVA with Bonferroni post-test adjustment b, c and one-way ANOVA with Tukey’s multiple-comparisons post-hoc test f. IF experiment was repeated twice using n = 3 tumors/group e and once with n = 4 tumors/group g, h. Data are presented as the mean ± SEM. Scale bars, 60 µm e, g, h. Source data are provided as a source data file.

