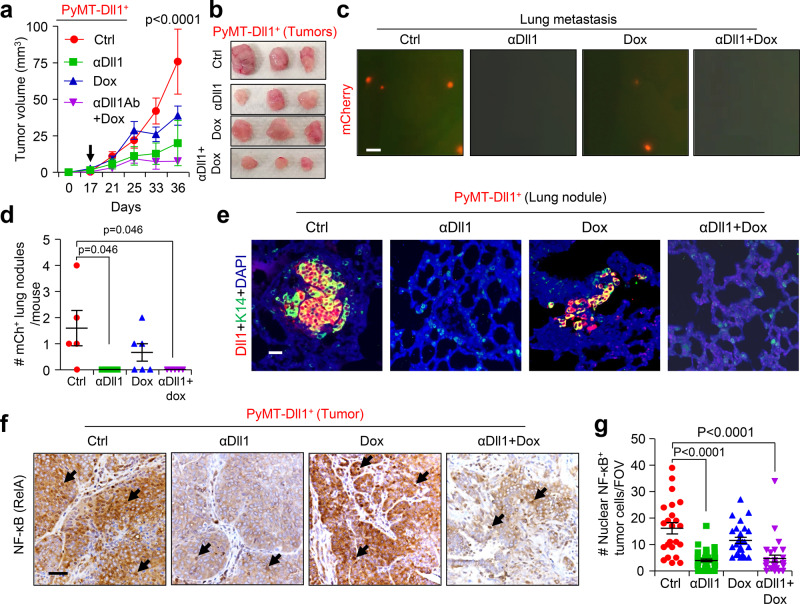
Fig. 6. The Dll1-blocking antibody treatment sensitizes the Dll1+ tumor cells to the chemotherapy.
a, b Tumor growth curves a and representative whole tumor images (b) after Dll1+ tumor cells derived tumors were treated with indicated treatments (more details are in Supplementary Fig. 9a) (n = 4 for ctrl, αDll1 ab, and αDll1 ab +Dox, n = 6 Dox tumors). The black arrow indicates the day when the treatments started. c–e Representative fluorescence images show mCherry+ nodules in whole lungs with quantification c, d. The scatter plot in d shows mCherry positive lung nodules, which were quantified under fluorescent dissection microscope after harvest (data combined from two independent experiments, n = 5 Ctrl, n = 5 αDll1 ab, n = 6 Dox, and n = 5 αDll1 ab + Dox tumors). e Representative IF images of lung cross sections show presence of mCherry+ cells (red). mCherry antibody was used to detect Dll1mCh+ cells. f, g The representative IHC images show the NF-κB staining in Dll1+ tumors upon indicated in vivo treatments, which is quantified in g. The dots in scatter plot represents the FOVs, which is obtained from n = 3 tumors per group. FOV is field of view. Black arrows indicate nuclear staining of NF-κB in tumor cells. P values were calculated using two-way ANOVA with Bonferroni post-test adjustment a or one-way ANOVA with Tukey’s post-hoc test d, g. Data present three c, e or two f independent experiments. Data are presented as the mean ± SEM. Scale bars, 200 µm c, 20 µm e and 60 µm f. Source data are provided as a source data file.

