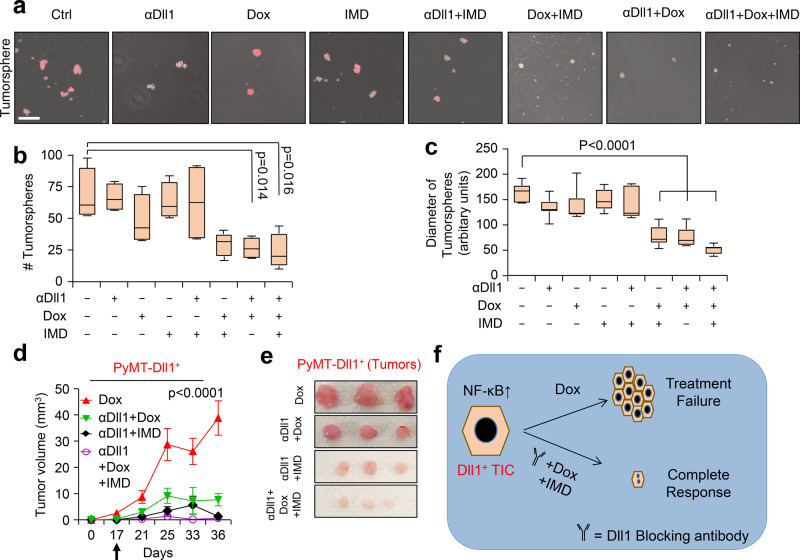
Fig. 7. Inhibition of NF-κB sensitizes Dll1+ tumor cells to chemotherapy.
a Representative fluorescence images show the tumorspheres of Dll1+ tumor cells with the indicated treatments. (IMD 100 nM, doxorubicin 80 nM, and Dll1 antibody 500 µg/ml). For combination treatment, 50 nM of IMD and 40 nM of doxorubicin were used. b, c The box plots show the quantification of tumorspheres in number b and diameter (c). The boxes represent the 75th, 50th, and 25th percentile of the values. The top and bottom lines represent maximum and minimal data points within the ×1.5 IQ (interquarter) range, respectively. d Tumor growth curves of tumors derived from Dll1+ tumor cells with indicated treatment (more details are in Supplementary Fig. 10d). The black arrow indicates the day when the treatments started. Representative whole tumor images are shown in the e. The alone doxorubicin and αDll1+Dox groups were used for both the experiments in Fig. 6a, b and 7d, e (n = 6 Dox, n = 4 αDll1 ab+Dox, n = 4 αDll1 ab+IMD, n = 6 αDll1 ab+Dox+IMD tumors). f, The model shows that PyMT-Dll1+ TICs are resistant to the doxorubicin treatment, along with increased nuclear translocation of NF-κB, which can be sensitized by blocking Dll1 using antibody and NF-κB inhibitor (IMD) along with doxorubicin. The combination treatment achieves a almost complete response in preclinical mouse models. P values were calculated using one-way ANOVA with Tukey’s post-hoc test (b, c) and two-way ANOVA with Bonferroni post-test adjustment (d). Data present two (a–c) independent experiments. Data are presented as the mean ± SEM. Scale bars, 100 µm (a). Source data are provided as a source data file.

