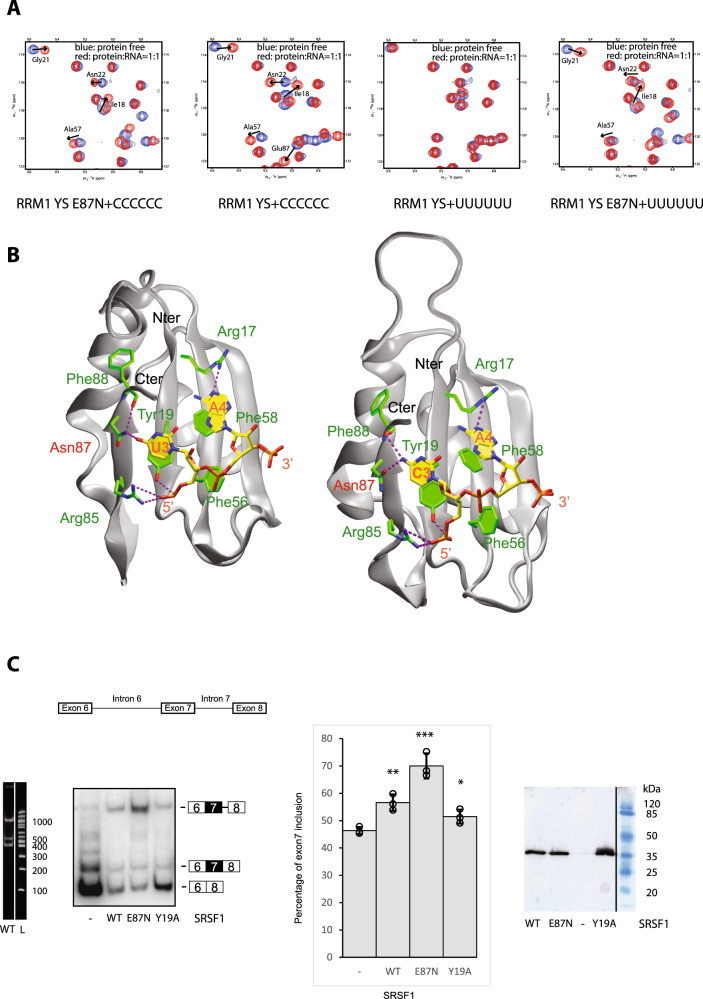
Fig. 3. Engineered SRSF1 E87N binds to uridines and activates SMN2 exon7 inclusion.
A Overlay of 1H-15N HSQC spectra measured with SRSF1 RRM1 YS and E87N free form (in blue) or in the presence of polyC or polyU molecules at a 1:1 ratio (in red). B Snapshot of the protein–RNA interactions observed during MD simulations with the complexes formed by SRSF1 RRM1 E87N and the AAUAAA or AACAAA RNA. The color scheme is the same as in Fig. 2. C Schematic representation of the SMN2 minigene. From left to right: 4% acrylamide gel with non-radioactive RT-PCR products showing the levels of SMN2 exon 6-8 isoforms upon overexpression of SRSF1 WT in HEK293 cells and the 100bp ladder of New England Biolabs. The white vertical line indicates the junction between two initially distant lanes present in the same gel. 4% acrylamide gel with radioactive RT-PCR products showing the levels of SMN2 exon 6-8 isoforms upon overexpression of SRSF1 WT, Y19A or E87N in HEK293 cells. Graph showing the percentage of SMN2 exon7 inclusion upon overexpression of WT and mutated versions of SRSF1. Standard deviations and arithmetic means are indicated. Stars indicate p values from two-sided Student’s test comparing SRSF1 constructs to the negative control (*p < 0.05 (0.036), **p < 0.01 (0.0057), and ***p < 0.001 (0.001)). Statistics were calculated from the three independent experiments. Data points of each experiment are shown as dot plots. Western blots showing the relative expression levels of the different Flag-tagged versions of SRSF1. The black vertical line indicates the junction between two initially distant lanes present in the same gel.

