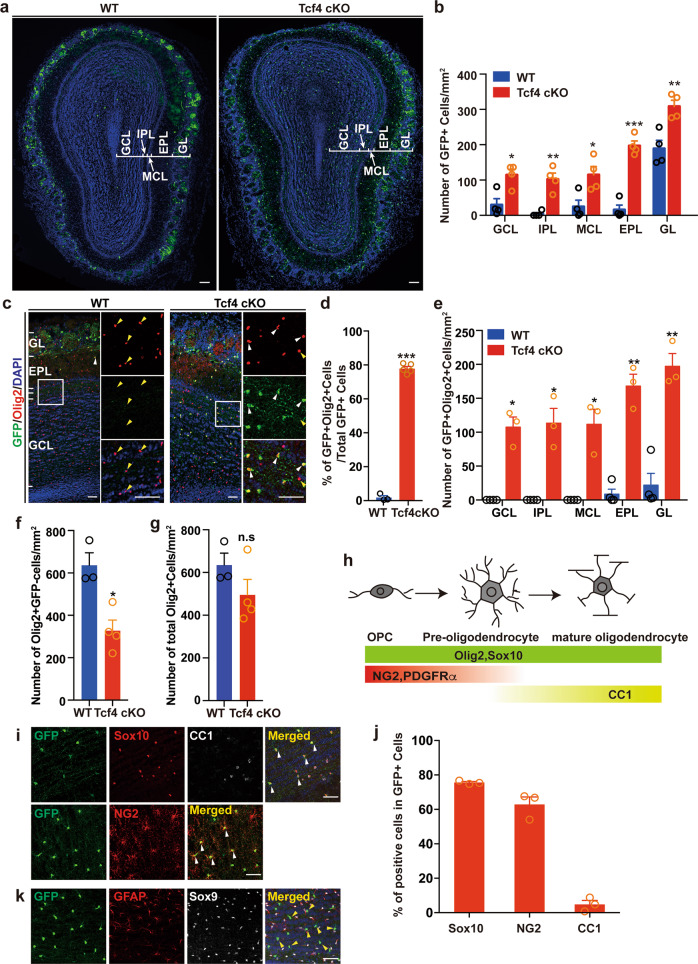
Fig. 2. Conditional deletion of Tcf4 in Nkx2.1 lineage leads to an increase of OPCs in the OB.
a Representative images showing GFP-positive cells from WT and Tcfk4 cKO OB. Scale bar: 100 μm. b Quantification of the distribution of GFP-positive cells. Student’s t test was used to compare two groups. Data are presented as mean ± SEM. *p < 0.05, **p < 0.01, and ***p < 0.001 (n = 4). c Representative images of RFP and Olig2 staining in WT and Tcf4 cKO OBs at P28. Small monochannels are the higher magnification of the solid square boxes. White arrowheads represent the GFP+Olig2+ cells and yellow arrowheads mark GFP−Olig2+ cells. Scale bar: 50 μm. d–g Quantifications of Nkx2.1-derived Olig2-positive cells (d) and their distribution in each layer of the OB (e), the number of non-Nkx2.1 derived Olig2-positive cells (f), and the total number of Olig2-positive cells in the OB (g). Student’s t test was used to compare two groups. Data are presented as mean ± SEM. *p < 0.05, **p < 0.01, n.s. nonsignificant. At least three samples were analyzed for each condition. h Diagram shows molecular markers expressed during OPC development. i Representative images show the immunostaining for GFP, Sox10, CC1, and NG2. White arrowheads indicate GFP+Sox10+ cells negative for CC1. j Quantification of cells is positive for either Sox10 or NG2 or CC1. k Representative images show the immunostaining for GFP, GFAP, and Sox9. Yellow arrowheads indicate GFP-positive cells which are negative for GFAP and Sox9. Scale bar: 50 μm.

