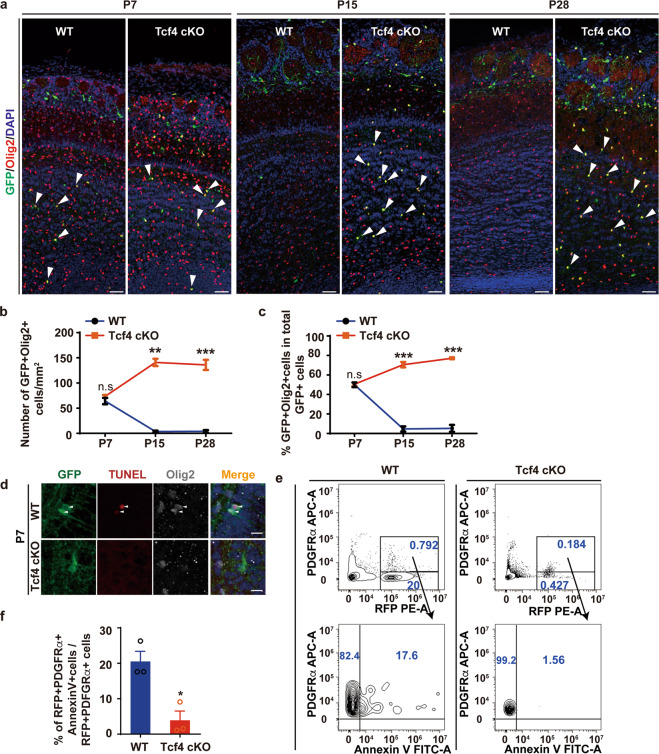
Fig. 4. Loss of Tcf4 results in programmed cell death in OPCs.
a Representative images of immunostaining for GFP and Olig2 at various developmental stages in both WT and Tcf4 cKO OBs. Arrowheads show OPCs. Scale bar: 50 μm. b, c Quantification of the density of OPCs (b) and the proportion of Nkx2.1-derived OPCs (c). Student’s t test was used to compare two groups. Data are presented as mean ± SEM. *p < 0.05, **p < 0.01, and ***p < 0.001. At least three OBs were analyzed for each genotype. d Representative images of immunostaining of GFP, TUNEL, and Olig2 in WT and Tcf4 cKO OBs at P7. Arrowheads indicate the OPCs undergoing cell death. Scale bar: 25 μm. e FACS analysis of OPCs undergoing cell death. f Quantification of the proportion of AnnexinV-positive OPCs in both WT and Tcf4 cKO OBs. Student’s t test was used to compare two groups. Data are presented as mean ± SEM. *p < 0.05, **p < 0.01, and ***p < 0.001. At least three OBs were analyzed for each genotype.

