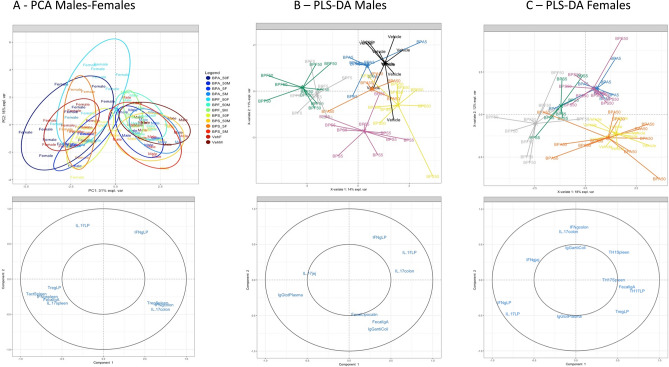
Figure 6.
Multivariate analysis representing immune profiles in function of BP dermal exposure and sex in adult offspring mice. (A) Sample score plot and associated loading plot on the first two PCA components resulting from all data set (without BW associated parameters) in males and females offspring mice. Each color indicated groups for each sex with 0.85% confidence level ellipse plots. (B) PLS-DA sample score plot and associated loading plot on the first two components derived from data set from all treated groups in male offspring mice (without BW associated parameters). (C) PLS-DA score plot and associated loading plot on the first two components derived from data set from all treated groups in female offspring mice (without BW associated parameters). Only loadings with correlation threshold > 0.5 were represented on the loading plots. % expl var: percentages for each first two components explained by the model. N = 5–12 offspring mice per group.

