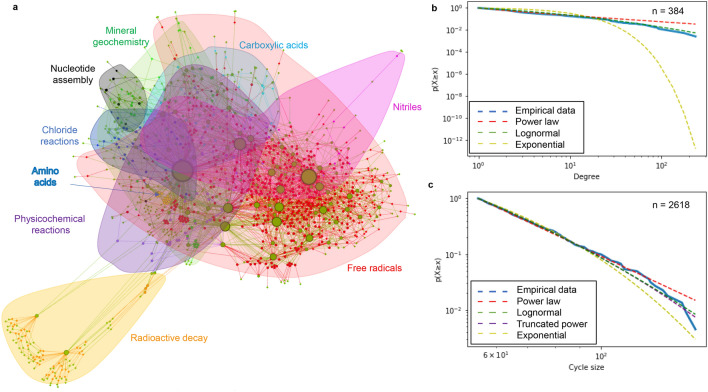
Figure 1.
Visualisation and statistical analysis of radiolysis network. (a) Bi-partite network with molecular species (green circles) size-weighted according to degree of connectivity to reactions (red circles). Groupings of chemical reaction categories are individually shaded and labelled. (b) Statistical comparison of species node degree connectivity distribution indicates that an exponential fall-off fit is poor compared to a power law or lognormal fit of the empirical data. (c) Statistical comparison of the cycle size distribution indicates that an exponential fall-off fit is not reliably distinguishable from a power law, lognormal or exponentially truncated power law fit of the empirical data.

