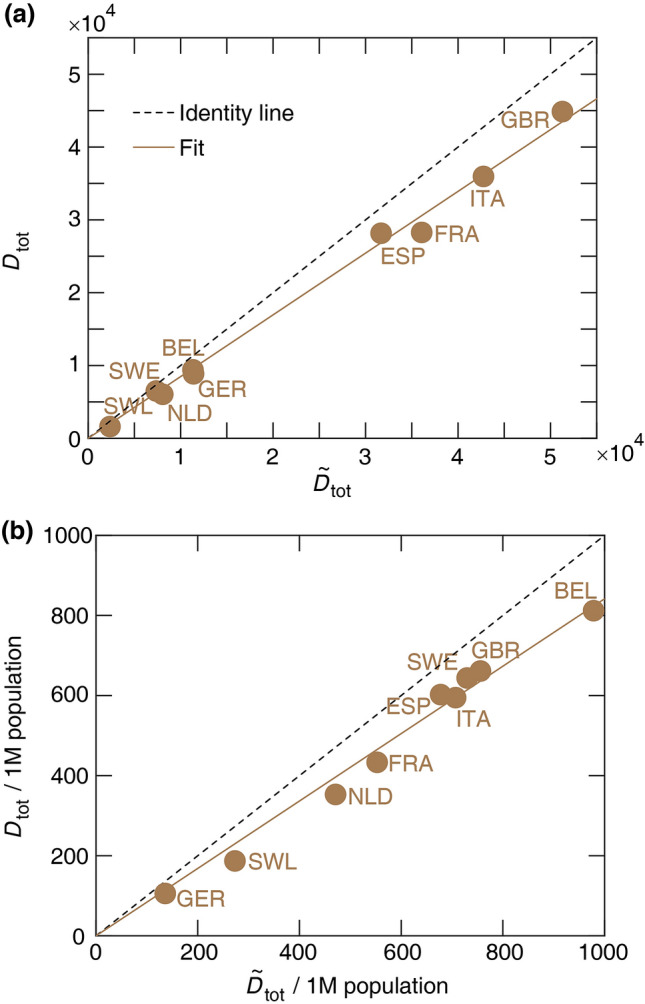
Figure 2.

Analytical estimate of the total number of COVID-19 deaths versus , the actual total death toll (a). (b) The same data are presented as per million (1M) population. The dashed and solid lines represent the identity and a linear regression, respectively. The slope of the linear regression is (a) and (b). Pearson coefficients of determination are (a) and (b) . Statistical data analysis was performed using MATLAB (version 2017b, The MathWorks, Inc.).
