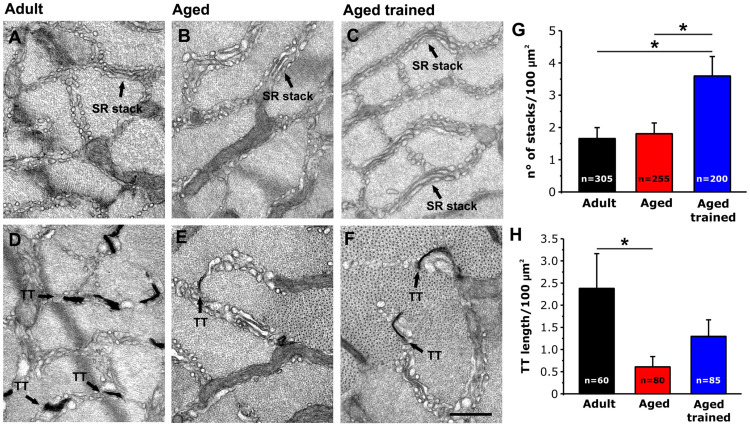
FIGURE 6.
Quantitative analysis by EM of SR stacks and TT length at the I band in EDL fibers. (A–F) Representative EM images of transversal sections of EDL fibers from adult (A,D), aged (B,E) and aged trained (C,F) mice. In (D–F) panels, TTs are stained with ferrocyanide (dark precipitate). (G,H) Bar plots showing the incidence of SR stacks (G) and the TT length at the I band (H). Arrows point to SR stacks in panels (A–C); arrows point to TTs stained with ferrocyanide in panels (D–F). Data are shown as mean ± SEM; *p < 0.05; n = number of measurements. Scale bar: (A–F), 0.1 mm.

