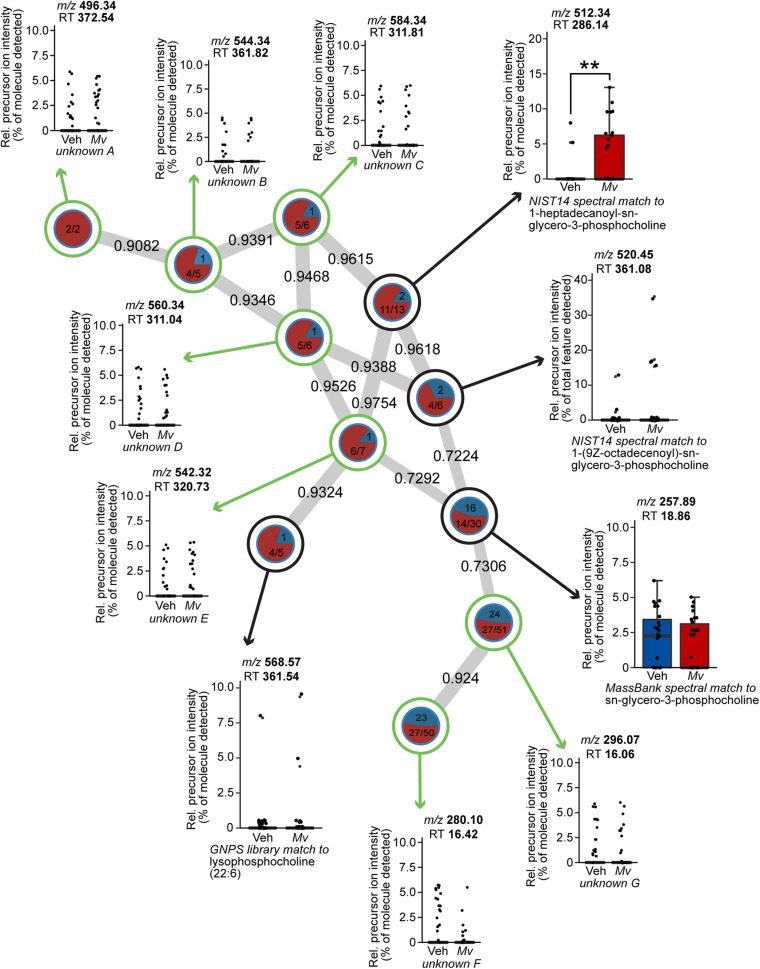
FIGURE 6.
Spectral network of a molecular family of lysophospholipids present in the untargeted plasma metabolomics dataset of mice from six independently tested cohorts of mice. Nodes from solvent blanks, standards, and controls were subtracted. Nodes are labeled according to treatment group origin (Veh, blue; Mv, red) if spectra came exclusively from a single group, as in unknown A, and are split into labeled frequency pie charts if spectra above the lower limit of detection came from both groups, as in unknown B. Nodes without a library hit are circled in green, identified according to precursor mass-to-charge ratio (m/z) and retention time (RT) in s, and annotated as unknowns A–G. Nodes with a library hit are circled in black and identified according to spectral database and library compound name, in addition to m/z and RT information as above. For sample sizes of each group, see Supplementary File S1. GNPS, Global Natural Products Social Molecular Networking; Mv, Mycobacterium vaccae NCTC 11659; m/z, mass-to-charge ratio; NIST, National Institutes of Standards and Technology; Rel., relative; RT, retention time; Veh, borate-buffered saline vehicle.

