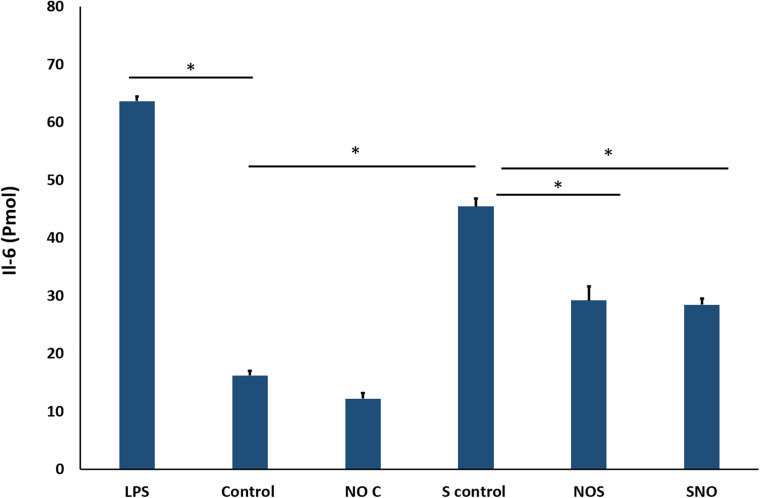
FIGURE 11.
ELISA result for IL-6. The signal is reported as the total detected signal in (Pmol) divided by the cell count for each condition. NOC Analysis was by one-way-ANOVA with Sidak post hoc test for multiple comparisons between the group. Data is presented as mean ± SEM. N = 4 for all groups. *Significant.

