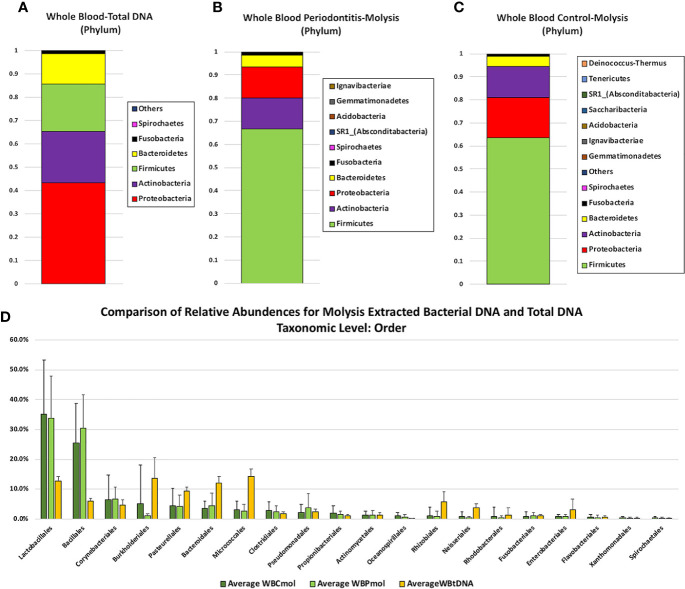
Figure 1.
Comparison of phylum level relative abundance profiles from (A) total DNA samples extracted from whole blood by PCI (n = 4), (B) Molysis-extracted DNA from whole blood from control patients (WBC) (n = 19), and (C) Molysis-extracted DNA from blood from patients with periodontitis (WBP) (n = 17).The OTU representing 3 members of the Streptococcus mitis group is designated SMG-subgroup. Panel 1(D) compares average percentage composition profiles for total DNA samples versus MolYsis-extracted samples at the Order level.

