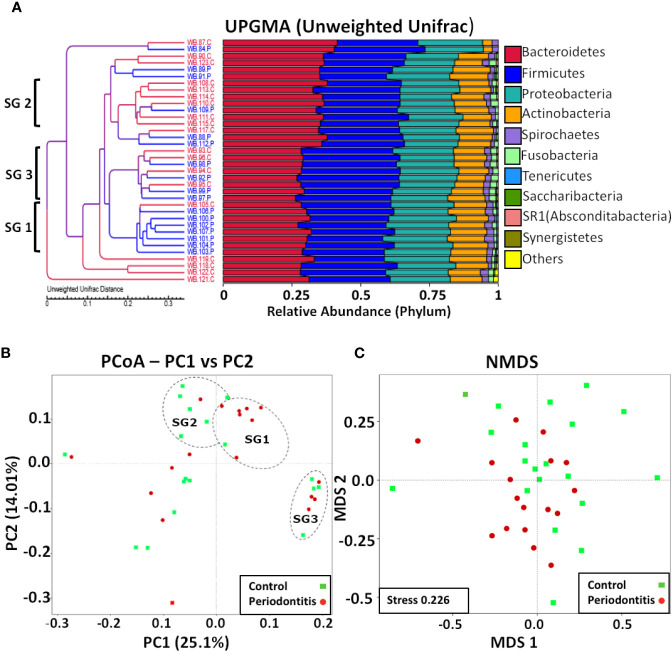
Figure 4.
Multivariate analyses of blood bacterial populations. (A) UPGMA of unweighted UniFrac distances showing percentage composition at the phylum level with three possible clusters suggested by brackets. (B). PCoA of unweighted UniFrac distances with healthy samples shown in green and periodontitis samples in red and possible clusters (SG1, SG2, and SG3) suggested by UPGMA indicated (for descriptive purposes only) with dashed outlines. (C) NMDS analysis showing possible partial partitioning according to health and periodontitis.

