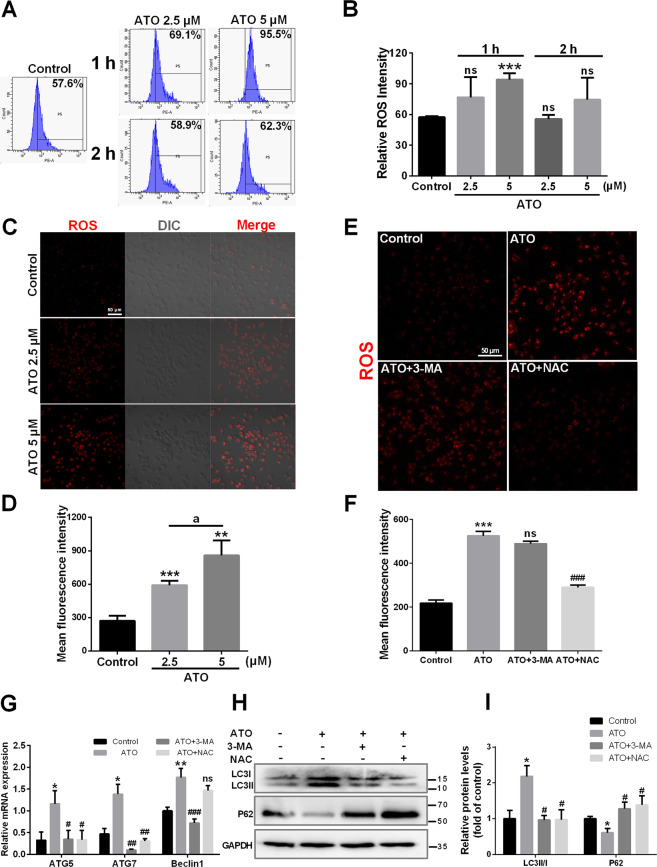
Fig. 3. ROS contribute to ATO-induced autophagy in macrophages.
A, B RAW264.7 cells were treated with two concentrations of ATO (2.5, 5 μM) for 1 h and 2 h. The relative fluorescence intensity for ROS generation was analyzed by flow cytometry. C, D Fluorescence microscopy images of ROS generation in RAW264.7 cells after treated with ATO (2.5, 5 μM) for 1 h. Scale bars=50 μm. ap < 0.05 vs. specified group. E–I RAW264.7 cells were treated with or without 3-MA(2.5 mM) or NAC (5 mM) followed by ATO (2.5 μM) for 2 h. E, F Fluorescence microscopy images of ROS generation in RAW264.7 cells in the presence of NAC or 3-MA following ATO treatment. Scale bars = 50 μm. G RT-qPCR analysis of ROS effect on autophagy via detecting specific autophagy genes including Atg5, Atg7 and Beclin 1 following incubate treatment. *p vs. the Control group, #p vs. the ATO group. H, I WB analysis of ROS effect on autophagy via detecting autopahgy specific proteins LC3 and P62 following incubate treatments. Data were expressed as mean ± SD from 3 independent experiments. *p < 0.05, **p < 0.01, ***p < 0.001, and ns means non-significant.

