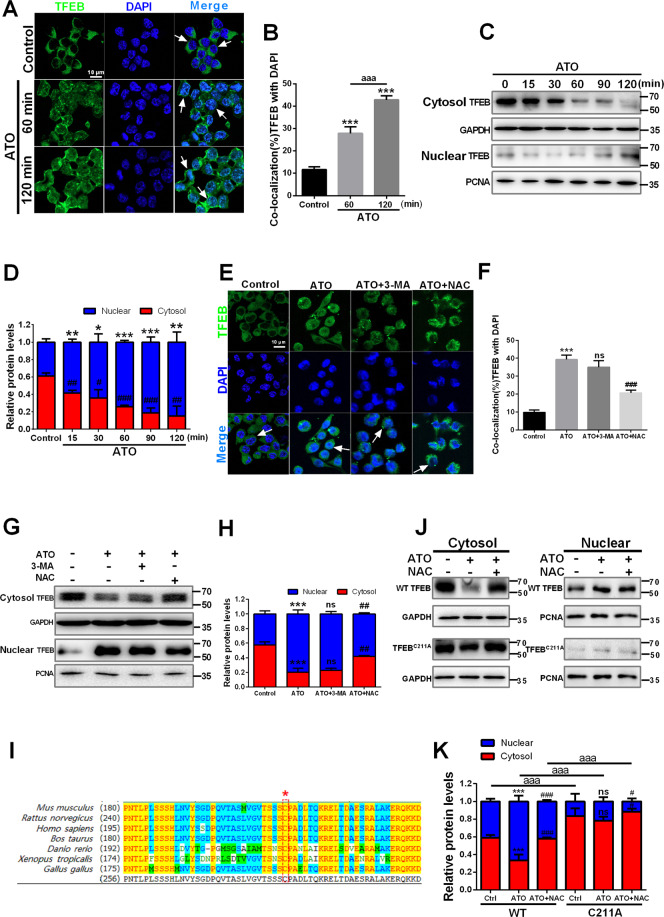
Fig. 4. ATO stimulates ROS-dependent nuclear translocation of TFEB in macrophages.
A, B RAW264.7 cells were treated with or without 2.5 μM ATO for 60 min and 120 min. After immunostaining with TFEB (green) and DAPI (blue), cells were examined by fluorescence microscopy. Scale bars = 10 μm. The colocalization of TFEB and DAPI was calculated and analyzed (right panel) aaap < 0.001 vs. Specified group. C, D WB analysis of subcellular distribution of TFEB in RAW264.7 cells between cytosol and nucleus after treated with 2.5 μM ATO for indicated time (15, 30, 60, 90, 120 min). The data are quantified in the panel d. *p vs. TFEB relactive expression in nuclear of control group, #p vs. TFEB relactive expression in cytoplasm of control group. E, F Immunofluorescence analysis of the effects of 3-MA (2.5 mM, 2 h) and NAC (5 mM, 2 h) on TFEB nucleus translocation in RAW264.7 cells following ATO (2.5 μM, 2 h) treatment. Scale bars=10 μm. G, H The effects of 3-MA (2.5 mM, 2 h) and NAC (5 mM, 2 h) on TFEB nucleus translocation in RAW264.7 cells following ATO (2.5 μM, 2 h) treatment were detected by western blots. I Protein sequence alignment of TFEB homologs in different species. The asterisk indicates the evolutionarily conserved cysteine residue. J, K RAW264.7 cells were transfected with WT or mutant TFEB C211A. After 24 h, the cells were treated with ATO (2.5 μM) for 15 min, which was pre-treated with or without NAC (5 mM) for 2 h. Then, the cell lysates were subjected to subcellular fractionation. The separated fractions were analyzed by immunoblotting with antibodies. *p vs. TFEB relative expression of Control group, #p vs. TFEB relative expression of ATO group, aaap < 0.001 vs. Specified group. Data were expressed as mean ± SD from 3 independent experiments. *p < 0.05, **p < 0.01, ***p < 0.001, and ns means non-significant.

