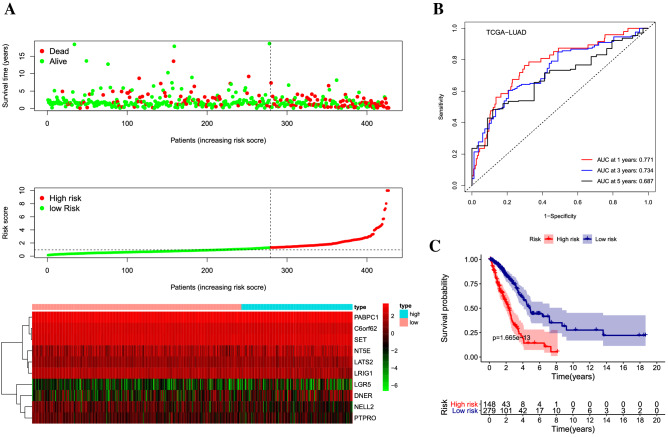
Figure 1.
Construction of signature. (A) The risk curve in the TCGA cohort displayed the patients’ risk score, survival time, and status, and expression of stem cell-related genes. The scales represented the expression level of each gene in each sample, which was established based on z-score transformed expression data. (B) ROC curve illustrated the risk prediction of the signature for 1, 3, and 5-year in the TCGA cohort. (C) Kaplan–Meier survival revealed the overall survival among different risk stratification groups.

