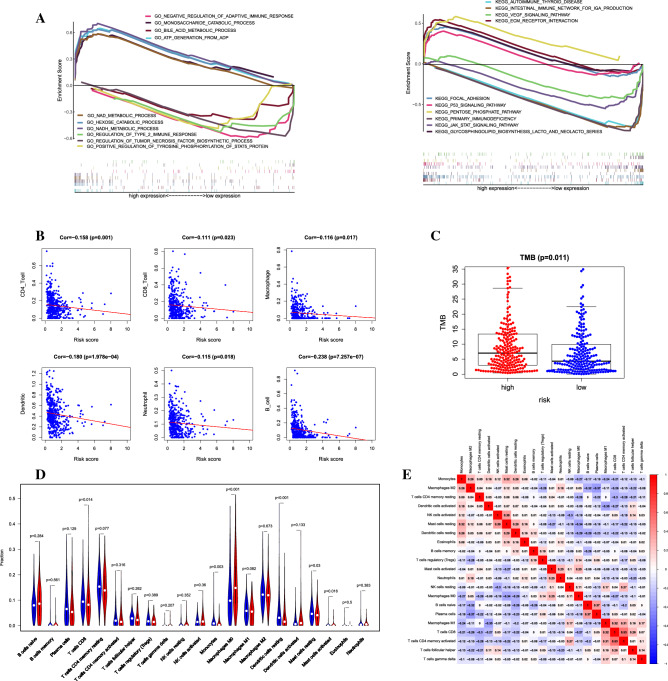
Figure 5.
Gene Set Enrichment Analysis and Immune infiltration analysis. (A) GO term and KEGG pathway showed five positive correlation groups and five negative correlation groups, respectively. (B) TIMER indicated the correlations among the six immune cells and signature. (C) Difference analysis of TMB in high-risk and low-risk groups. (D) Composition of 21 kinds of immune cells in high-risk and low-risk groups. (E) Correlation heat map of 21 immune cells in LUAD.

