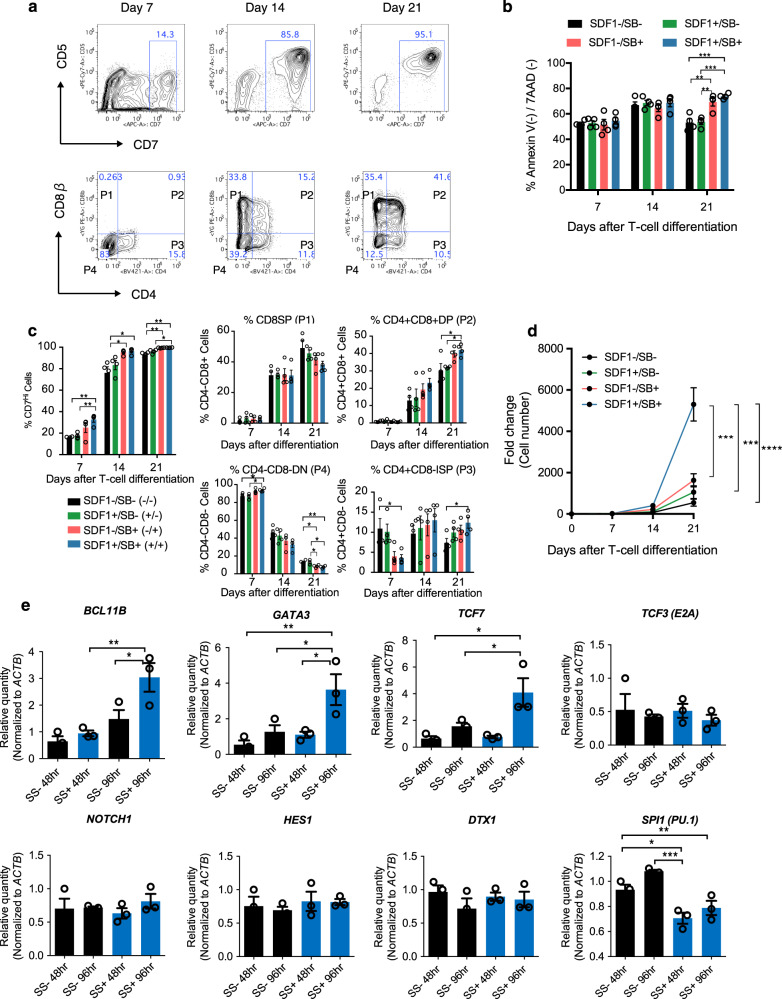
Fig. 2. Optimization of T-cell differentiation in DL4 and RN cultures.
a Representative kinetic flow cytometric analysis of T-cell differentiation on DL4 and RN cultures assessed at the indicated days. b Frequencies of Annexin V(-)/7-AAD (-) live cells in differentiating cultures over 3 weeks in the presence or absence of SDF1α and/or SB203580 (n = 4). c Frequencies of the indicated cell types defined as in (a) in the differentiation culture over 21 days in the presence or absence of SDF1α and/or SB203580 (n = 4). d Kinetics of differentiating T-iPSC-HPC counts over 21 days on DL4 and RN in the presence or absence of SDF1α and/or SB203580 (n = 4). e Gene expression related to T-cell differentiation, Notch signaling pathway, and a myeloid lineage gene (SPI1 (PU.1)) detected by qPCR after T-iPSC-HPCs were cultured for 48 or 96 h on DL4 and RN + / − SS (n = 3). Data represent mean ± SEM of n independent experiments.*P < 0.05; **P < 0.01; ***P < 0.001 by one-way ANOVA with Tukey’s multiple comparison test.

