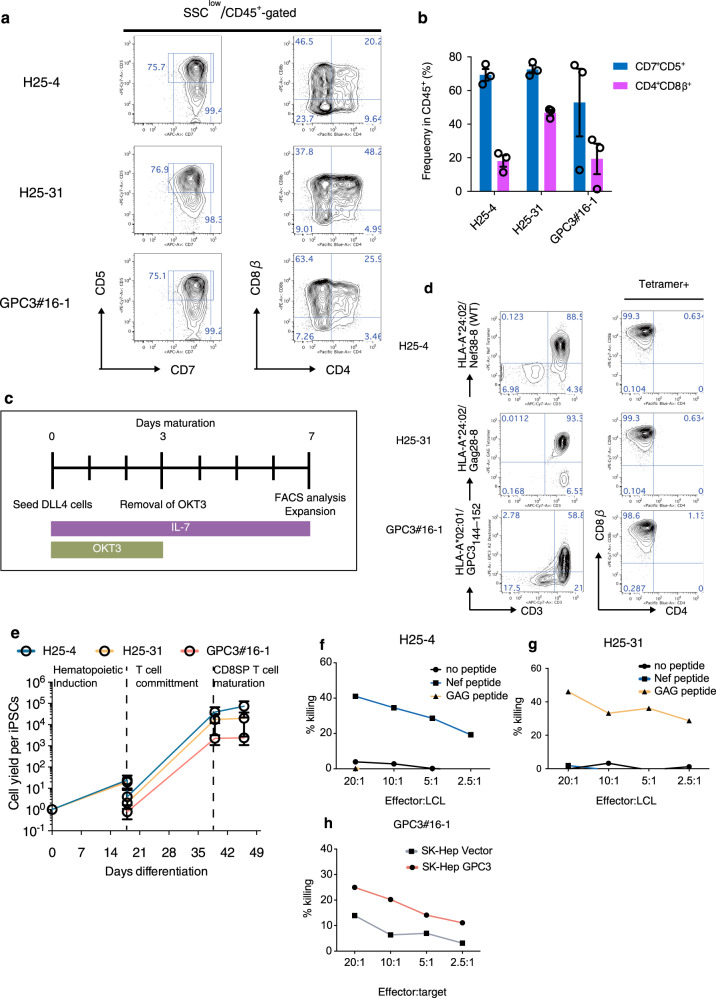
Fig. 3. Generation of CD8αβ+ T-cells from antigen-specific T-iPSCs in the optimized condition.
a Representative flow cytometry plots of three T-iPSC-derived differentiating cells after 21 days in SS + condition showing expression levels of CD5 vs CD7 and CD8αβ vs CD4. b Frequencies of CD5+CD7+ progenitor T-cells (blue) and CD4+CD8αβ+ DP-cells (purple) generated from the indicated T-iPSC-HPCs after 21 days on DL4/RN + SS condition (n = 3). c Schedule of maturation of DL4-cells to induce CD4−CD8αβ+ T-cells. d CD4−CD8αβ+ T-cell yield as determined by input T-iPSC count during differentiation processes. e Representative flow cytometry plots obtained 42 days after differentiation (after 7 days in maturation culture as shown in (c) showing the expression levels of tetramer and CD3 (left) and CD8β and CD4 (right) of regenerated T-cells (n = 3). Data represent mean ± SEM of n independent experiments. f–h In vitro cytotoxicity assay of proliferated CD8αβ+ SP T-cells measured by 51Cr release assay using LCL cells loaded with specific peptides (Nef38 for H25-4 (f) and Gag28-8 for H25-31 (g)) or SK-Hep cells transduced with GPC3 or empty vectors (GPC3#16-1 (h)) as target cells. Data are representative of two independent experiments.

