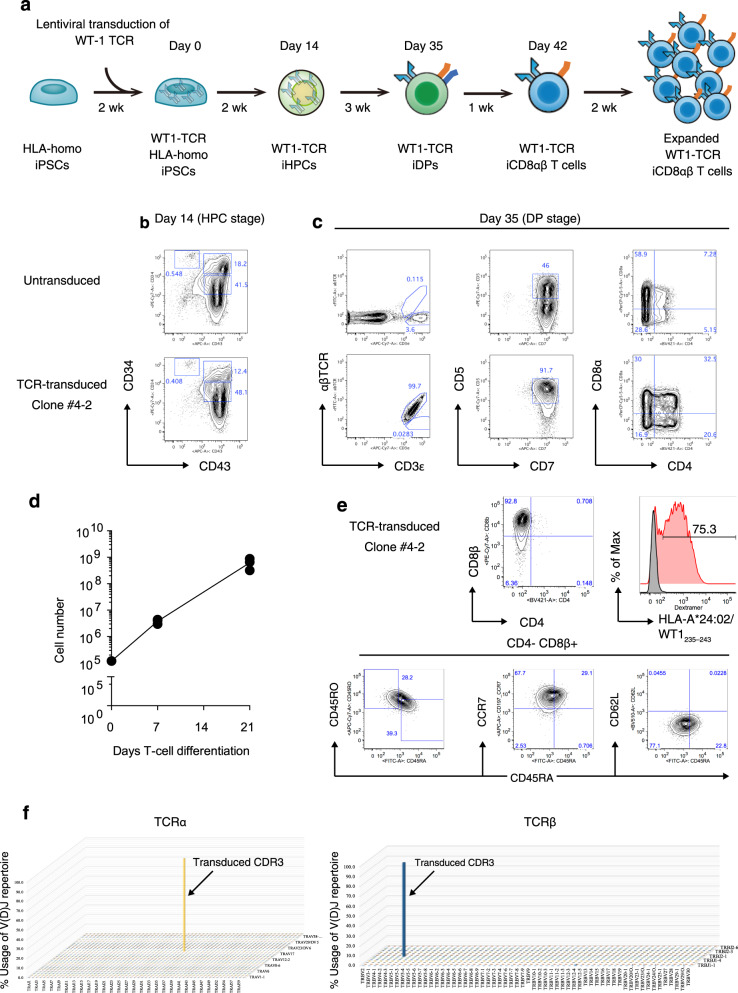
Fig. 4. Generation of CD8αβ+ SP T-cells from TCR-transduced HLA-homo iPSCs.
a Scheme of production starting from HLA-homo iPSC to WT1-TCR-transduced iPSC CD8αβ+ T-cells. Wk, week; HPCs, hematopoietic progenitor cells; DP, CD4+CD8+ double-positive; CTLs, CD4−CD8αβ+ cytotoxic T-cells. b, c Flow cytometry plot of differentiating untransduced (top) or WT1-TCR transduced (bottom) HLA-homo iPSCs (b) 14 days after differentiation (HPC stage) gated on the CD14−CD235α− population and (c) 35 days after differentiation (DP stage) showing the expression levels of αβTCR and CD3 (left), CD5 and CD7 (middle), and CD8α and CD4 (right) (n = 3). d Kinetics of total differentiating cell count during T-cell differentiation in a large-scale culture generated from 1 × 10⁵ WT1-iPSC-HPCs seeded on a DL4/RN-coated 10 cm dish (n = 3 independent experiments). Data represent mean ± SD. e Flow cytometry plots of mature CD4−CD8αβ+αβTCR+ T-cells generated from WT1-transduced HLA-homo iPSCs at day 42 after differentiation. f VDJ frequency of WT1-TCR-transduced iPSC CD8 SP T-cells determined by next-generation sequencing of CDR3 regions of TCRα (left) and TCRβ (right) (n = 3 independent experiments).

