Figure 4.
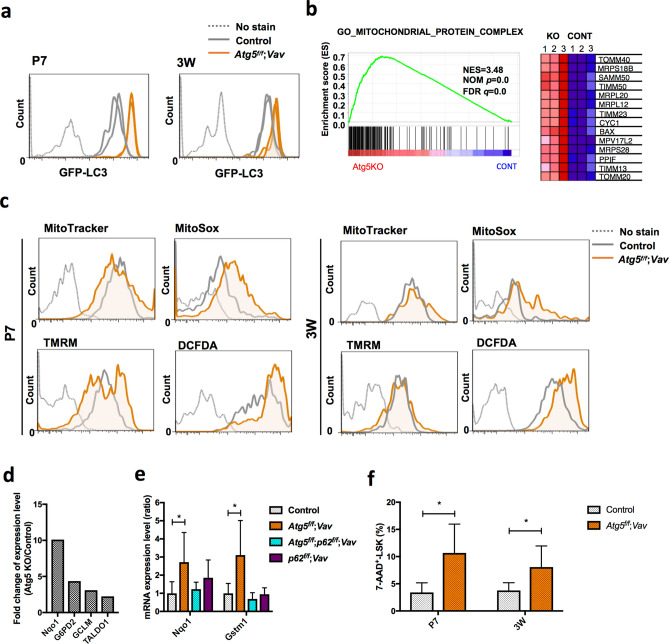
Gene expression and mitochondrial status in LSK cells from control and Atg5f/f;Vav mice. (a) Flow cytometric analysis of GFP-LC3 in LSK cells from control (GFP-LC3;Atg5f/w;Vav and GFP-LC3;Atg5f/w) and GFP-LC3;Atg5f/f;Vav mice at P7 and 3W. Representative data (two control and two Atg5f/f;Vav) from two independent experiments are shown (P7, n = 5–7; 3W, n = 3–5). (b) GSEA enrichment score curve for control (Atg5w/w;Vav) and Atg5f/f;Vav LSK cells analysed for the gene set associated with the mitochondrial protein complex. Heatmap of representative gene expression in the gene set is shown at the right. NES, normalised enrichment score; FDR, false discovery rate. (c) Flow cytometric analysis of MitoTracker green, MitoSox Red, TMRM, and DCFDA staining in LSK cells from control and Atg5f/f;Vav mice at P7 and 3 weeks. Representative data from at least three independent experiments are shown (n = 3–5). (d) Fold change of representative Nrf2-target gene expression levels upregulated in Atg5f/f;Vav LSK cells compared with control LSK cells from normalised microarray data. (e) mRNA expression levels of Nqo1 and Gstm1 in LSK cells from control, Atg5f/f;Vav, p62f/f;Vav, and Atg5f/f;p62f/f;Vav mice at 7 weeks. Data are the mean ± SD. n = 3–6. (f) Frequency of dead cells (7-AAD-positive cells) in LSK population from control (Atg5f/w;Vav) and Atg5f/f;Vav mice at P7 and 3W. Data are the mean ± SD (n = 4–5).

