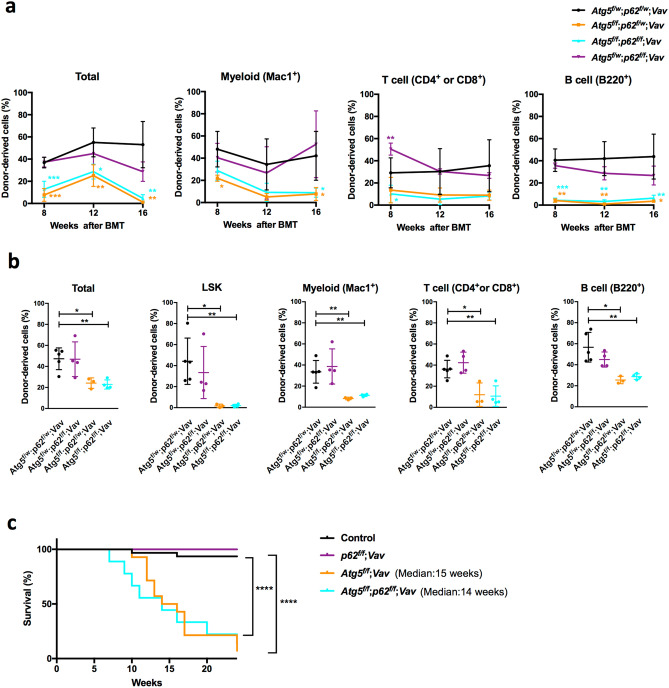
Figure 6.
Competitive reconstitution analysis and survival assay. (a,b) Competitive reconstitution analysis of BM cells from Atg5f/w;p62f/w;Vav,Atg5f/f;p62f/w;Vav,Atg5f/f;p62f/f;Vav, and Atg5f/w;p62f/f;Vav mice at 3 weeks. (a) Frequencies of donor-derived cells among total cells and lineage cells in PB were analysed 8–16 weeks after transplantation. Data are the mean ± SD (n = 3–5). (b) Frequencies of donor-derived cells among total, LSK, myeloid, T, and B cells in BM were analysed 16 weeks after transplantation. Data are the mean ± SD (n = 3–5). Horizontal line indicates the mean of values. (c) Survival curve of control (n = 31), p62f/f; Vav (n = 6), Atg5V; Vav (n = 13), and Atg5f/f; p62f/f; Vav (n = 9) mice.

