Figure 7.
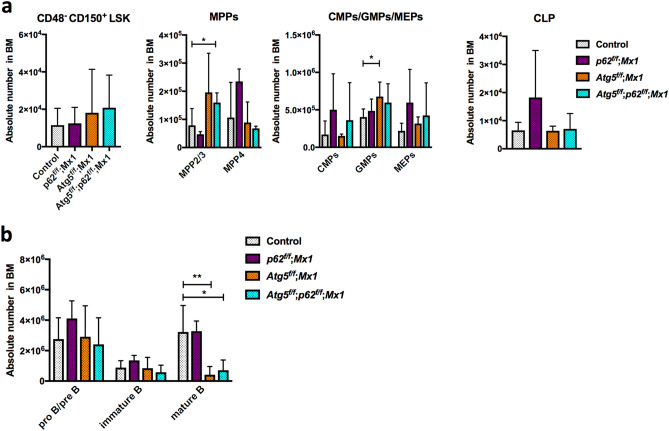
Comparative analysis of HSCs, progenitors, and B cells in BM from control, p62f/f; Mx1, Atg5f/f; Mx1, and Atg5f/f; p62f/f; Mx1 mice. (a) Absolute numbers of CD48−CD150+LSK cells, multipotent progenitors (MPPs; MPP2/3 and MPP4), common myeloid progenitors (CMPs), granulocyte macrophage progenitors (GMPs), megakaryocyte erythrocyte progenitors (MEPs), and common lymphoid progenitors (CLPs) in BM. Data are the mean ± SD (n = 4–7). (b) Absolute numbers of mature B (CD43−B220hiIgM+), immature B (CD43−B220loIgM+), and pro B/pre B (CD43−B220loIgM−) cells in BM. Data are the mean ± SD (n = 5–7).

