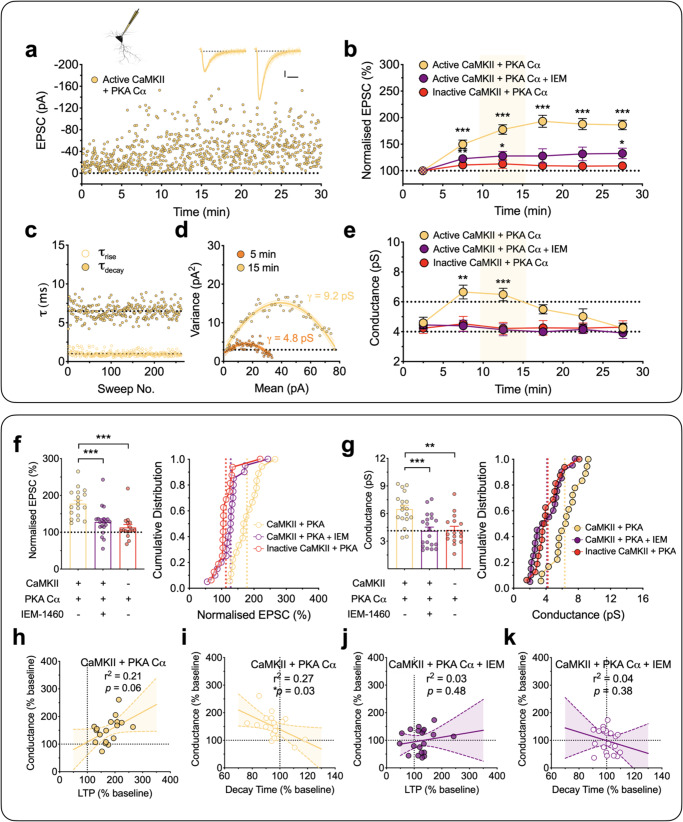
Fig. 6. CaMKII plus PKA Cα results in a transient synaptic insertion of CP-AMPARs and increase in γ.
a–k Equivalent experiments as described in Fig. 5c–k but with the inclusion of activated CaMKII (250 U/mL) plus the catalytic subunit of PKA (PKA Cα, 300 U/mL) in the internal solution. Scale bars: 10 pA and 10 ms. b Pooled results (mean ± SEM, 5-min bins) for the effects on EPSC (%) by active CaMKII + PKA Cα (n = 18 neurons from 15 animals, F(2.560,43.52) = 38.34, one-way repeated measures ANOVA), CaMKII + PKA Cα + IEM-1460 (IEM, 30 µM; n = 20 neurons from 15 animals, F(2.064,39.22) = 4.079) and heat-inactivated CaMKII + PKA Cα (n = 16 neurons from 14 animals, F(2.682,40.23) = 1.301). Bonferroni’s post hoc multiple comparisons test; *p < 0.05, **p < 0.01 and ***p < 0.001 vs. the initial 5 min of whole-cell recording. e Time course for the estimates of γ. One-way repeated measures ANOVA followed by Bonferroni’s multiple comparisons test (*p < 0.05, **p < 0.01 and ***p < 0.001 vs. the initial 5 min of whole-cell recording); F(3.219, 54.72) = 9.927 (CaMKII + PKA Cα), F(4.067,77.28) = 0.5990 (CaMKII + PKA Cα + IEM) and F(3.587,53.80) = 0.1366 (heat-inactivated CaMKII + PKA Cα). Quantification for the levels of LTP (F(2,51) = 14.19) (f) and γ (F(2, 51) = 9.210) (g). One-way ANOVA followed by Bonferroni’s multiple comparisons test; *p < 0.05, **p < 0.01 and ***p < 0.001. h, i Analysis of the relationships between γ and LTP (p = 0.0618, F(1,16) = 4.073, F-test) (h) and EPSC decay time (p = 0.0340, F(1,16) = 5.440, F-test) (i) for CaMKII + PKA Cα. j, k Analysis of the relationships between γ and LTP (p = 0.4775, F(1,18) = 0.5263, F-test) (j) and EPSC decay time (p = 0.3760, F(1, 18) = 0.8241, F-test) (k) for CaMKII + PKA Cα + IEM. Data are presented as mean ± SEM. Source data are provided as a Source Data file.

