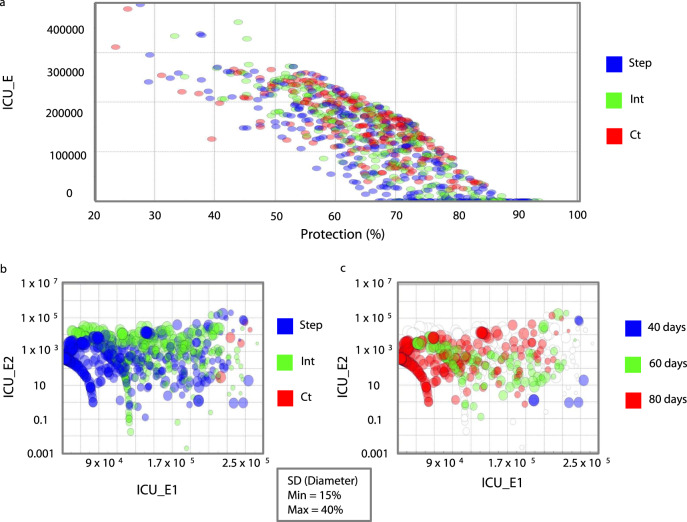
Fig. 2. Mitigation strategies optimization results for the state of São Paulo.
a Design of experiment results showing the influence of social distancing (SD) strategy (red color indicates constant (Ct) SD strategy; green color indicates intermittent (Int) SD strategy; blue color indicates stepping down (Step) SD strategy) and the percentage ratio of the unsusceptible or protected people over the whole population (Protection), x-axis, on the total number of critical cases over the ICU threshold (ICU_E), y-axis, for the entire period of analysis (end-day 25 December 2021). b Constrained optimization results showing the influence of strategy (color) and SD magnitude (circle diameters corresponding to variations between 15 and 40%) on the number of critical cases over ICU threshold for the first (ICU_E1), x-axis, and the second peak of the pandemic (ICU_E2), y-axis. c Constrained optimization results showing the influence of Window size (red color indicates 80-day windows; green color indicates 60-day windows; blue color indicates 80-day windows) and SD magnitude (circle diameters) on ICU_E1, x-axis, and ICU_E2, y-axis.

