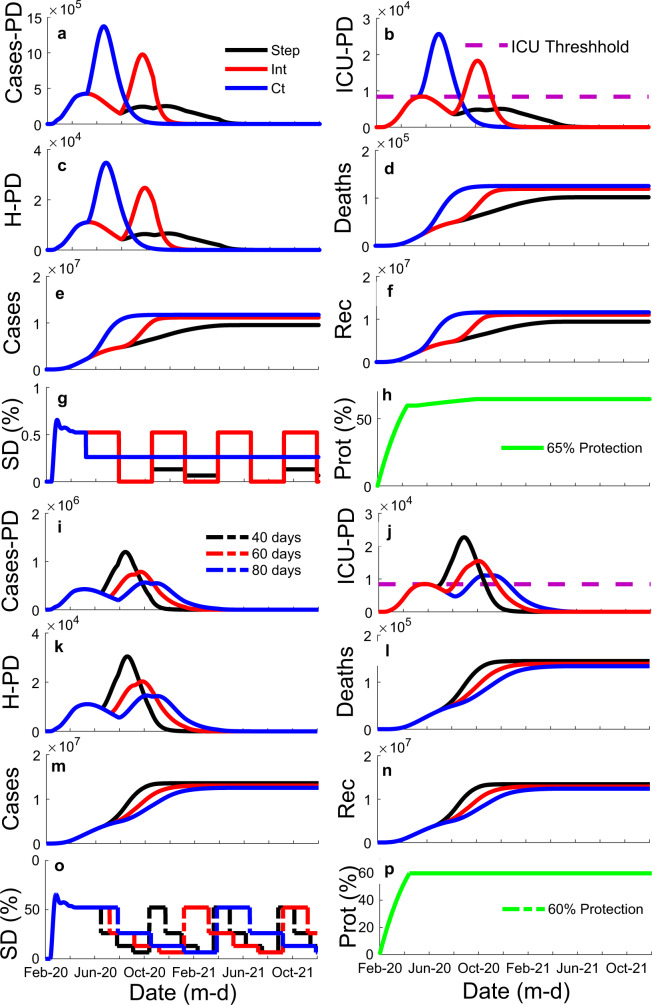
Fig. 3. Illustration of the influence of social distancing (SD) variation strategies (stepping down, intermittent, and constant) and different time windows (40, 60, and 80 days) on the model results for the state of São Paulo.
It shows influence of strategy (colored lines: black—stepping down (step); red—intermittent (Int); blue—constant (Ct)) through time, x-axis, on: a the number of cases per day (Cases-PD); b the number of estimated intensive care unit patients per day (ICU-PD); c the number of estimated hospitalized patients per day (H-PD); d the number of estimated accumulated deaths; e the number of accumulated cases; and f the number of recuperated cases. g Manipulations of SD through time, illustrating the three different strategies tested. h The percentage ratio of the unsusceptible or protected people over the whole population (protection—Prot (%)) through time for graphs a–f. It also shows the influence of different time windows (colored lines: black—40-days; red—60 days; blue—80 days)) through time, x-axis, on: i Cases-PD; j ICU-PD; k H-PD; l accumulated deaths; m accumulated cases; and n recuperated cases. o Manipulations of SD through time for graphs i–n, all three curves represent a stepping down strategy, but with three different time window sizes. p Protection through time for graphs i–n.

