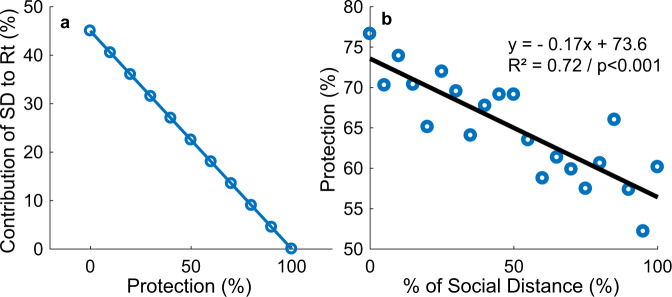
Fig. 7. The relationship between social distancing (SD) and the percentage ratio of the unsusceptible or protected people over the whole population (Protection).
a It shows how the effect of a 45% SD in reducing effective reproduction number (Rt) as Protection percentage increases from 0 to 100%. b Sensitivity analysis determining the effect of changes in social distancing (SD) on protection percentage, considering 5% decrements to the magnitude of SD with respective linear regression equation, y = −0.17x + 73.6, and Pearson’s correlation coefficient squared, R2 = 0.72, F1,19 = 48.891, p < 0.001, 95% CI [−0.223, −0.120].

