Figure 5.
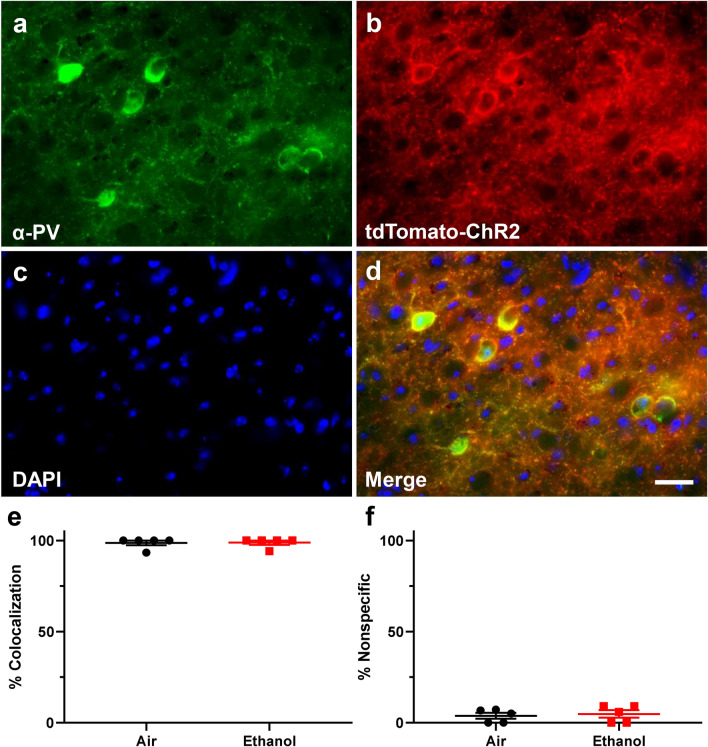
Representative immunohistochemistry (IHC) images from B6 PVcre-Ai27D mice and analysis of both penetrance and specificity of transgene expression. (a–d) Representative IHC images showing colocalization of PV and ChR2- tdTomato. (a) IHC demonstrating PV expression. (b) Expression of endogenous ChR2–tdTomato transgene expression. (c) DAPI nuclear stain. (d) Merged image. Scale bar 25 µm. (e) Penetrance analysis of B6 PVcre-Ai27D transgene expression. Penetrance of transgene expression was measured as the number of PV expressing cells colocalized with tdTomato divided by the number of PV expressing cells. (f) Specificity analysis of B6 PVcre-Ai27D transgene expression. Specificity of transgene expression was measured as the number of cells expressing only tdTomato divided by the number of cells expressing both PV and tdTomato. Air male n = 3 animals from 3 litters, air female n = 2 animals from 2 litters; ethanol male n = 3 animals from 3 litters, ethanol female n = 2 animals from 2 litters. Data are presented as mean ± SEM.

