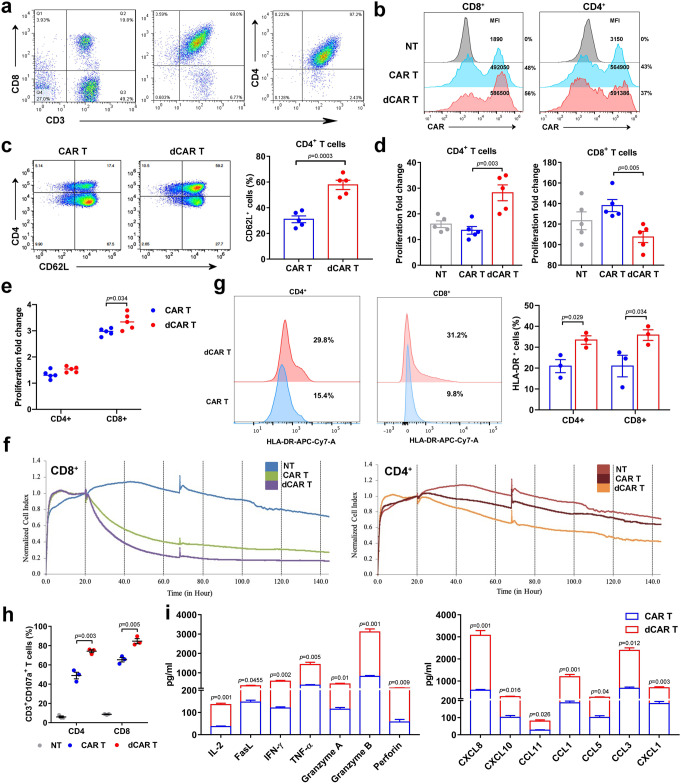
Fig. 4. Enhancement of cell function in CD4- and CD8-positive CAR T cells after DAC treatment.
a CD4- or CD8-positive subsets separated at the beginning of CAR T-cell culture underwent magnetic selection processes using human CD8 + or CD4 + T-cell isolation kits (Miltenyi Biotec), respectively, and the negative fraction was collected. b Representative percentage of CAR-positive T cells and MFI indicating CAR expression on CD4-positive or CD8-positive CAR T cells. c The CD62L expression of CD4-positive T cells in CAR T and dCAR T cells. d The proliferation fold change was obtained by the number of cell counts on the 10th day after cell culture compared with the number of cells before cell culture. e Cell count analysis of CAR T-cell proliferation as measured after 24 h of co-culture with Raji cells at an E:T ratio of 1:1. The data in c, d and e are from three independent experiments with five samples. f Continuous graphical output of cell index values up to the 144-h time point from Raji cells during incubation with NT, CD4-positive and CD8-positive CAR and dCAR T cells at an E:T ratio of 1:5 determined using the xCELLigence Impedance system. (n = 2). g Flow cytometry analysis of HLA-DR expression in CD4-positive and CD8-positive CAR T cells co-cultured with Raji cells at an E:T ratio of 1:1 for 24 h. h Flow cytometry analysis of CD107a expression on CD4-positive and CD8-positive CAR T cells after their co-culture with Raji cells at an E:T ratio of 1:1 for 0.5 h. The data in g and h are from three independent experiments with three samples. i Cytokine production by CD4-positive dCAR and CAR T cells co-cultured with Raji cells at an E:T ratio of 1:1 for 24 h was measured by Luminex assay according to the manufacturer’s instructions (n = 3). All data are the mean ± s.e.m. P values for all panels were calculated by two-tailed unpaired t tests.

