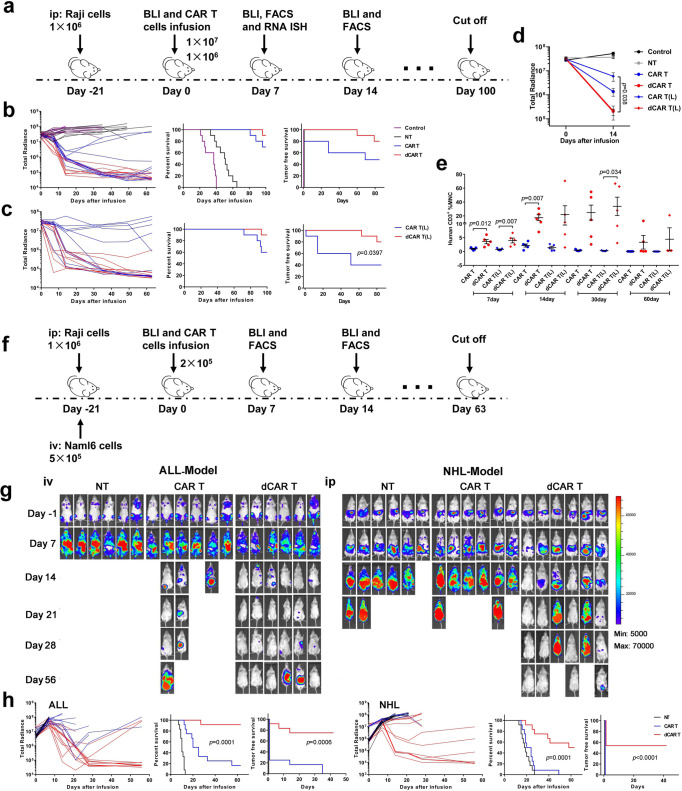
Fig. 7. dCAR T cells display enhanced in vivo antitumour activity against a large tumour burden at the lowest dose examined.
a In vivo experimental layout. A total of 1 × 10⁶ luciferase-expressing Raji cells mixed with Matrigel were intraperitoneally (i.p.) transferred to NPG mice. Tumour growth was monitored by BLI. After 21 days, effector cells (or the same volume normal saline as a control) were injected (i.v.), after which the tumour burden was assessed by monitoring BLI with the schedule shown. b, c, Left panel: Tumour burden in mice treated with 1 × 10⁷ CD19 CAR T or dCAR T cells (b) and 1 × 10⁶ CD19 CAR T or dCAR T cells (c) was monitored using BLI imaging. Survival (middle panel) and tumour-free survival (right panel) were analysed by Kaplan–Meier analysis (ten mice examined over two independent experiments). “L” was defined as 1 × 10⁶ cell treatment group. d Tumour burden of the mice (n = 5) were assessed by determining BLI radiance on days 0 and 14. e The percentage of CAR T cells in the PB was used to evaluate the expansion and persistence of CAR T cells at the indicated time points (n = 5). MNC mononuclear cell. Data for d and e are presented as the mean ± s.e.m. P values for d and e were calculated by two-tailed unpaired t tests. f In vivo experimental layout. NHL model: A total of 1 × 10⁶ luciferase-expressing Raji cells mixed with Matrigel were i.p. transferred to NPG mice. ALL model: A total of 5 × 10⁵ luciferase-expressing Nalm-6 cells were i.v. transferred to NPG mice. After 21 days, 2 × 10⁵ effector cells were injected (i.v.) (12 mice examined over two independent experiments). g Representative graph: BLI images showing mouse tumour burdens at the indicated time points of one experiment. h (left panel: ALL) and (right panel: NHL). Left panel: Tumour burden in mice after treatment with CD19 CAR T or dCAR T cells was monitored using BLI imaging. Survival (middle panel) and tumour-free survival (right panel) were analysed by Kaplan–Meier analysis. P values for b, c and h were determined by the log-rank Mantel–Cox test, two-tailed.

