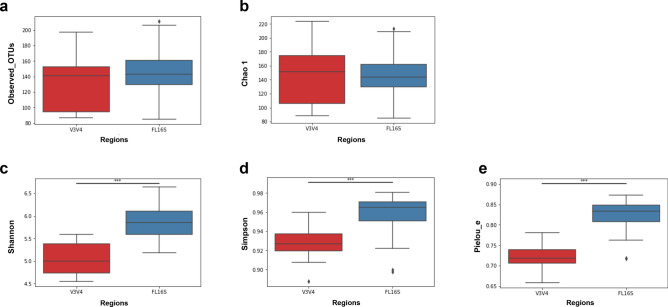
Figure 2.
Comparison of average alpha-diversity scores between two different 16S sequencing methods. Box plots show the average alpha-diversity scores of both sequencing methods, which were measured by using (a) Observed_OTUs, (b) Chao 1, (c) Shannon, (d) Simpson, and (e) Pielou_e indices. Estimation of ASV richness and evenness using the number of observed OTUs (a) (Kruskal–Wallis H-test, H = 1.08, P = 0.29), Chao 1 (H = 0.0001, P = 0.99), Shannon diversity index (H = 27.43, P = 1.62*10–7), Simpson (H = 17.17, P = 3.4*10–5), and Pielou_e (H = 28.74, P = 8.27*10–8) are shown. The red and blue boxes indicate average alpha-diversity of V3V4 and sFL16S, respectively. The asterisk (*) represents the p-value of the statistical test (*** < 0.0001). Detailed information for this result is in Table 2.

