Figure 3.
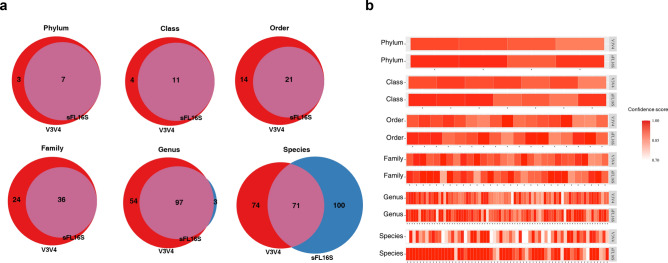
Comparison of bacterial taxonomy classification according to two different 16S amplicon regions. (a) The Venn-diagram is divided into two different methods (red: V3-V4 amplicon and blue: sFL16S) and shows the number of a classified bacterial taxon at the phylum to species level. (b) The heatmap shows the frequency of the only identified taxa in both methods drawn by each taxonomic rank, in order. The bacterial taxon belonging to the four major phyla (Bacteroidetes, Firmicutes, Actinobacteria, and Proteobacteria), to the species, showing the confidence score of each taxon. The darkness of the color is proportional to the confidence score's value, as shown in the color bar.

