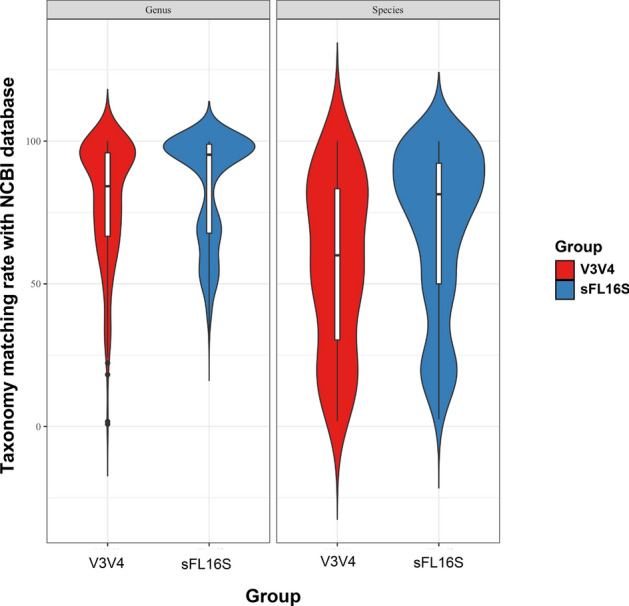
Figure 6.

Comparison of taxonomy matching accuracy for V3V4 and sFL16S on NCBI Bacterial Genome Database. Violin plots represent matching rates that result from taxonomy matching analysis in the NCBI Bacterial Genome Database (40 K bacterial and archaeal genomes), according to taxonomic rank (genus and species). Using the NCBI reference 16S sequence data, we conducted the BLAST search to determine the matching rate with the ASV taxonomy data in two different methods. The y-axis indicates the percentiles of the taxonomy matching rate. The violin plots are filled in red (left) and blue (right) for V3V4 and sFL16S data, respectively. The boxes indicate the mean value (black bold horizontal line), percentiles of the taxonomy matching rate distribution. The upper and low whiskers indicate the maximum and the minimum value of the taxonomy matching rate, respectively. The shaded area surrounding the boxes on each side indicate the ASV frequency of the taxonomy matching rate.
