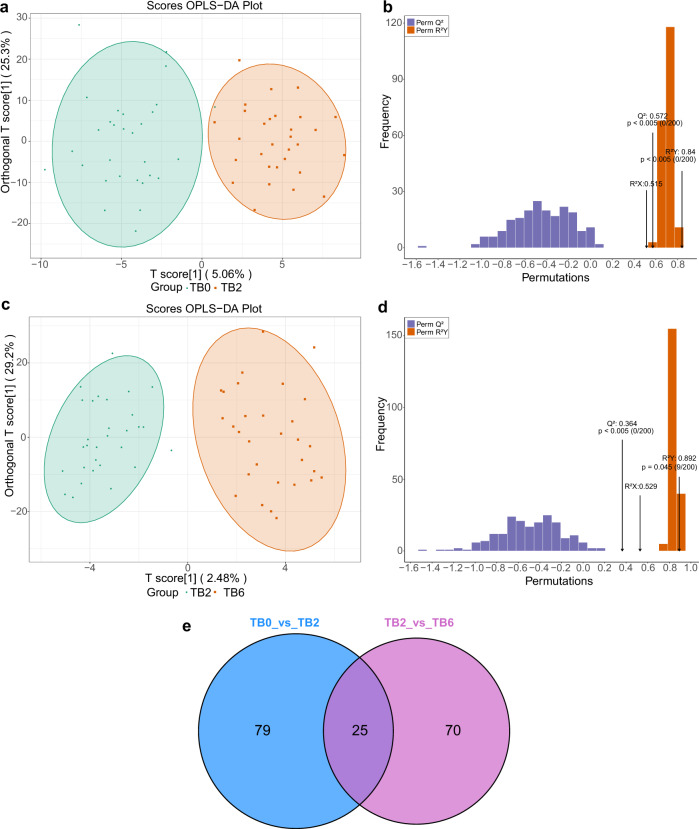
Fig. 2.
Establishment and validation of OPLS-DA model (TB0 group vs. TB2 group, TB2 group vs. TB6 group), and screening of dynamically changing lipids. a OPLS-DA model was able to separate the TB2 group from the TB0 group clearly based on the selected lipid metabolites. b The model has good prediction ability, permutation test showed that R2X (cum) = 0.515, R2Y(cum) = 0.840, Q2(cum) = 0.572. c OPLS-DA model was able to separate the TB6 group from the TB2 group clearly based on the selected lipid metabolites. d The model has good prediction ability, permutation test showed that R2X (cum) = 0.529, R2Y(cum) = 0.892, Q2(cum) = 0.364. e In all, 25 lipid metabolites with the significant statistical difference between the TB0 group and TB2 group, and TB2 group and TB6 group were found in the Venn intersection of the comparison

