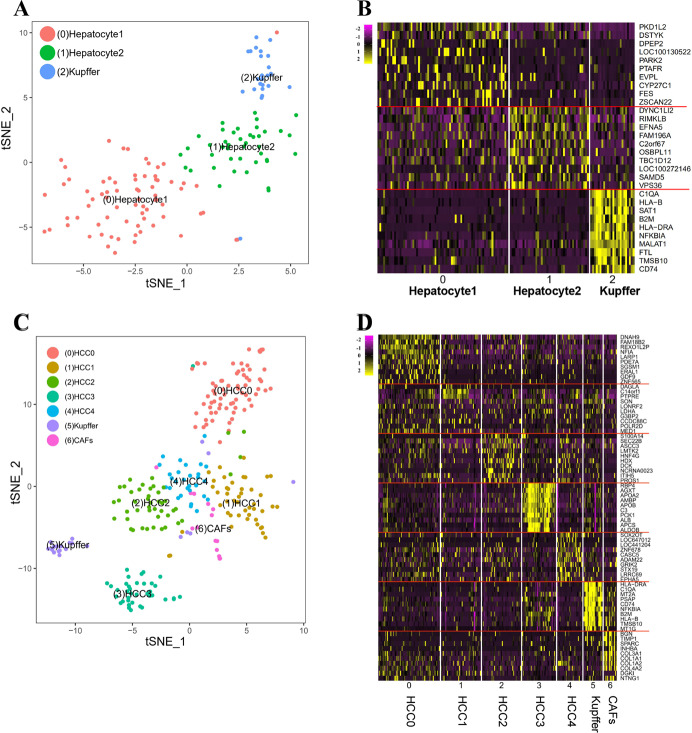
Fig. 1. Singles cell subpopulations and specific DEGs identification in HCC tissues.
A The t-SNE projected three main subclones of single cells clusters from para-tumor tissues. Each cluster was labeled with Arabic number. B Heatmap of the normalized top 10 DEGs of single cells clusters in three main subclones from para-tumor tissues. C The t-SNE projected seven main subclones of single cells clusters from HCC tissues. D Heatmap of the normalized top 10 DEGs of seven main subclones in HCC tissues.

