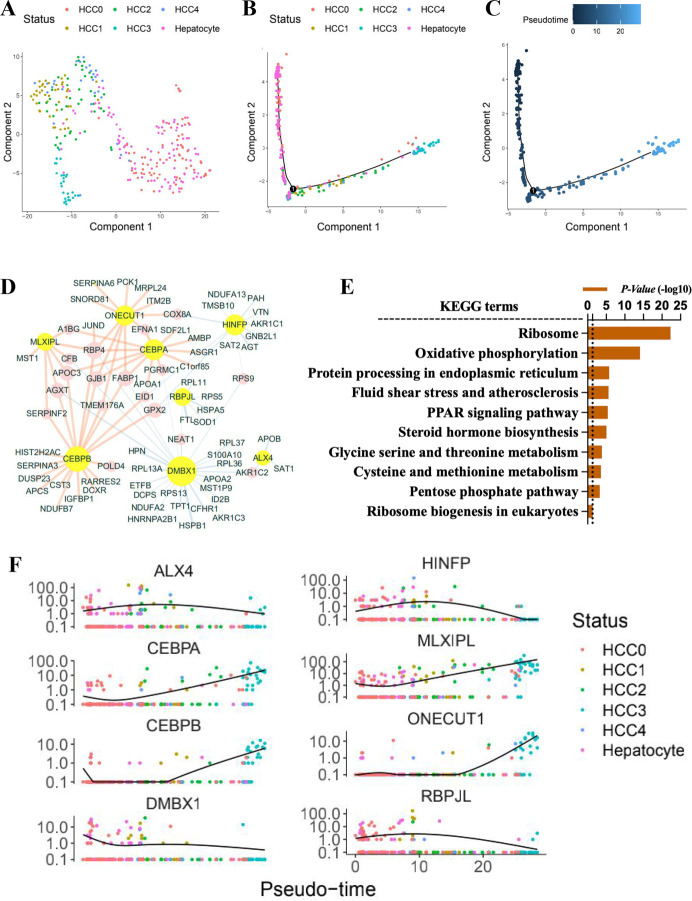
Fig. 4. Cellular trajectory pattern and its major driving genes.
A An unsupervised t-SNE plot showed sporadic distributed five HCC clusters in HCC tissues, and hepatocellular cells in para-tumor tissues. B Cellular trajectory of five HCC cells subpopulations and para-tumor hepatocytes. The t-SNE plot revealed the distribution of single cells determined by Monocle. C The direction of the cellular trajectory determined by unsupervised pseudo-time. D Regulatory co-networks of cellular trajectory-related transcription factors and their regulated genes. Genes in yellow circles were the most critical transcription factors. E GOBP functional annotation related to the cellular trajectory. F Plots showed the trends of expression profiles of eight key transcription factors in different subclones as pseudo-time.

