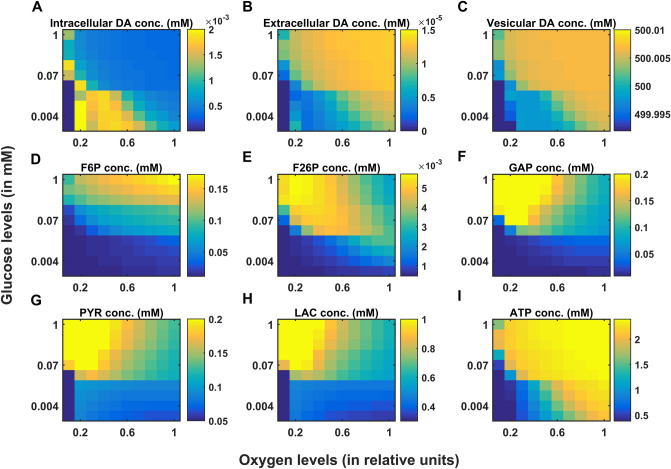
Figure 6.
Model response to hypoglycemia and hypoxia conditions. Average intracellular dopamine (DA) concentration (A), average extracellular DA concentration (B), average vesicular DA concentration (C), average fructose-6-phosphate (F6P) concentration (D), average fructose-2,6-biphosphate (F26P) concentration (E), average glyceraldehyde-3-phosphate (GAP) concentration (F), average pyruvate (PYR) concentration (G), average lactate (LAC) concentration (H), average adenosine triphosphate (ATP) concentration (I) of the model for varying glucose and oxygen concentrations. conc, concentration; mM, millimolar.

