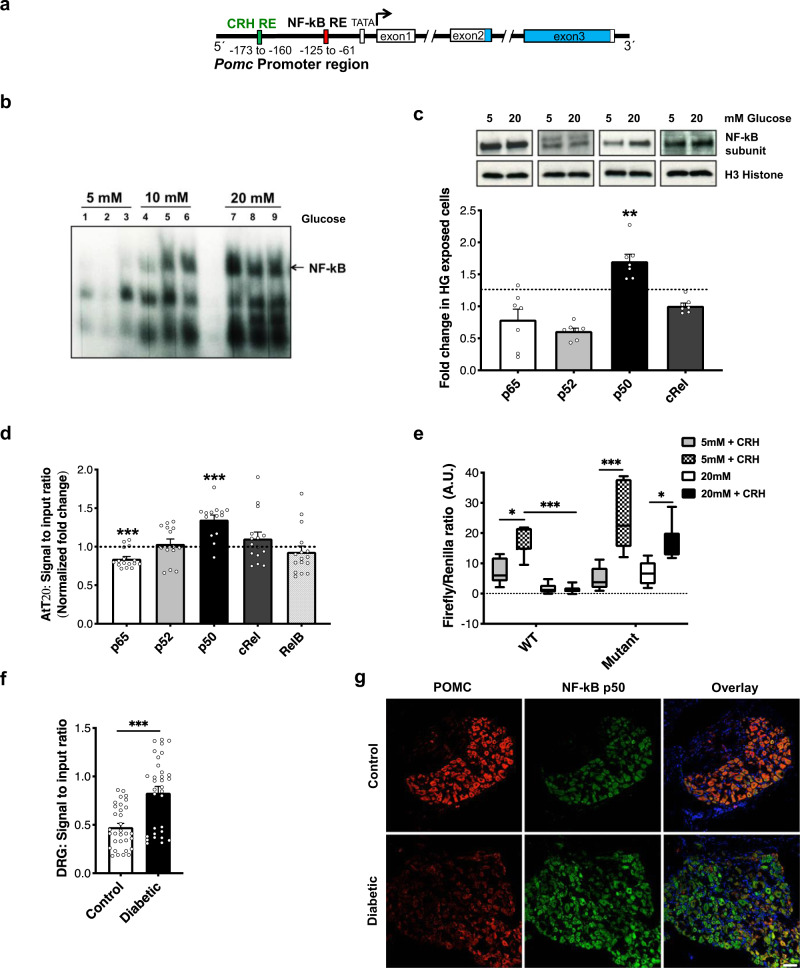
Fig. 4. High glucose represses Pomc promoter.
a Schematic representation of Pomc promoter region containing the NF-kB binding region in close proximity to the CRH binding region. b NF-kB activation measured as a function of its DNA binding ability, using EMSA, in the nuclear lysates of AtT-20 cells exposed to increasing glucose concentrations for 12 h. c Representative blots and densitometric quantification of NF-kB subunit proteins in the nuclear lysates of AtT-20 cells exposed to normal (5 mM; NG) or high (20 mM; HG) glucose conditions for 12 h, using subunit-specific antibodies. Bands detected at p65 (∼65 KDa), p52 (∼60 KDa), p50 (∼50 KDa), cRel (∼72 KDa). Histone H3 (∼10 KDa) normalization used to obtain densitometric ratio for each subunit (n = total 7 replicates/group taken from two independent experiments; two-tailed t-test for comparison between NG and HG exposed cells per subunit; **p = 0.002). Dotted line represents basal level for each subunit in cells exposed to NG. d Binding of each NF-kB subunit to Pomc promoter in AtT-20 cells exposed to NG or HG for 12 h (n = total 14–16 replicates/group taken from 4 independent ChIP assays; two-tailed t-test for comparison between NG and HG exposed cells per subunit;***p < 0.0001). Dotted line represents binding of each NF-kB subunit in cells exposed to NG. e Pomc promoter activity measured in AtT20 cells transfected with a wild-type Pomc promoter-luciferase construct (WT) or a promoter construct mutated at NF-kB binding site (Mutant). Promoter activity quantified under NG or HG exposure condition (12 h) as function of response to the promoter agonist, corticotropin-releasing hormone (CRH; 10−8 M, 6 h) (n = total 7 replicates per exposure condition taken from 2 independent experiments; two-way ANOVA followed by Sidak’s post-hoc test; *p = 0.01, ***p < 0.0001). f ChIP assay in lumbar DRG of control and diabetic mice to quantify the binding of NF-kB p50 to Pomc promoter in vivo (n = 8 female mice/group; two-tailed t-test;***p < 0.0001). g Typical examples of co-immunostaining using antibodies for NF-kB p50 and POMC (Gt antibody) in the lumbar DRG of control and diabetic mice (n = 6 female mice/group, 3–7 DRG sections from each mouse). For panels (c), (d), (f), data represent mean ± SEM; circles represent individual data points. The boxplot in panel (e) corresponds to median, 25th, and 75th percentiles, whiskers correspond to minimum and maximum values. Scale = 50 μm. For all panels, 95% C.I. Source data are provided as a Source Data file.

