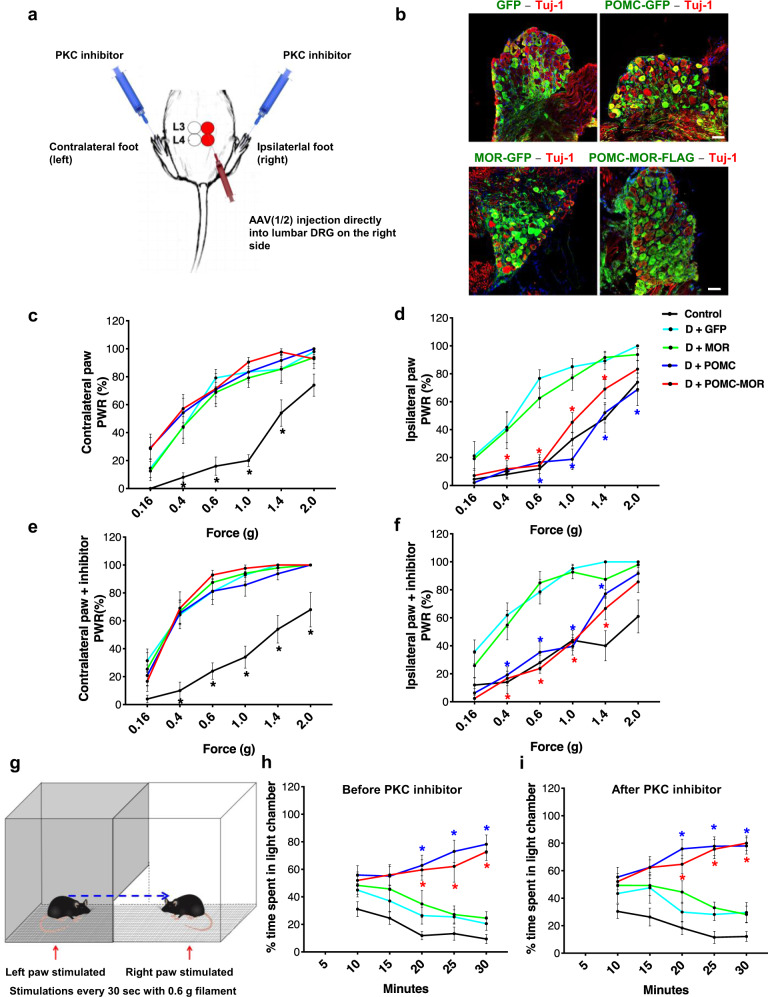
Fig. 6. Genetic reconstitution of POMC rescues mechanical hyperalgesia and its aversive effects.
a Schematic representation of direct DRG injection in diabetic mice with rAAV-1/2 constructs for overexpressing GFP, POMC, MOR, or POMC-MOR. Readings taken before and after intraplantar injection of PKC inhibitor in both hindpaws (Gö6983, 20 μM, 45 min). b Immunostaining of AAV-injected DRG with GFP- or FLAG-specific antibodies showing expression of the viral constructs (n = 8 mice/group). c–f Mechanical hypersensitivity measured using von Frey filaments in naïve control (non-diabetic, non-AAV injected) and AAV-1/2-injected diabetic mice. Pain measurements performed before (c, d) and after (e, f) intraplantar injection of PKC inhibitor (naïve control, n = 10; D + GFP, n = 7-8; D + MOR, n = 8; D + POMC, n = 8; D + POMC-MOR, n = 7). PWR = paw withdrawal responses. g Schematic representation of place escape/avoidance paradigm (PEAP) test. The % of time spent in the light chamber measured, h before and i after injection of PKC inhibitor in both hindpaws (naïve control, n = 11; D + GFP, n = 8; D + MOR, n = 10; D + POMC, n = 9–10; D + POMC-MOR n = 10). For panels (c and e), *black star indicates significant difference between readings of each mice cohort and readings of control mice. For panels (d, f, h, i), *blue star indicates significant difference between readings of D + POMC and D + GFP cohort, while *red star indicates significant difference between D + POMC-MOR mice and D + GFP mice readings. For all panels, female mice data are shown; data represent mean ± SEM; two-way ANOVA followed by Dunnett’s post-hoc test; *p < 0.05 with 95% C.I. Cyan line: D + GFP, green line: D + MOR, blue line: D + POMC, red line: D + POMC-MOR. Scale=50 µm. p-values are given in Supplementary Tables T5–T10. Source data are provided as a Source Data file.

