Figure 3.
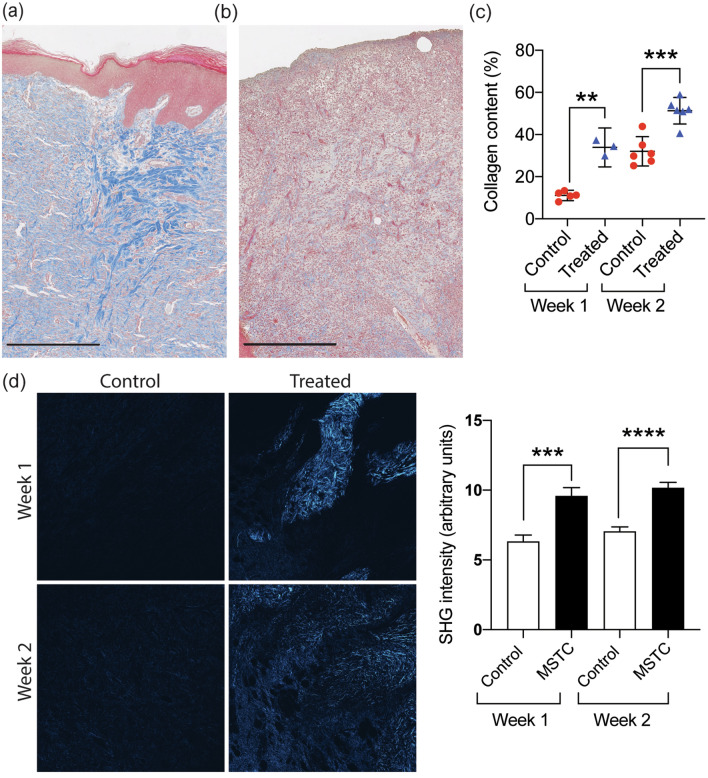
MSTC treatment increased dermal collagen content. Representative trichrome images of MSTC-treated (a) and control (b) wounds at 2 weeks. Collagen is stained in blue. Scale bars = 500 μm. Quantification of collagen staining shown in (c). MSTC-treated wounds had significantly higher collagen content at both 1- and 2-week time points. (d) Fibrillar collagen visualized by second-harmonic generation (SHG) imaging. At both time points there were discrete regions with strong SHG signal within MSTC-treated wounds, while SHG signal was largely absent in control wounds. Images shown represent images with intensities that are nearest the mean for each respective group. Each image is 1.9 mm wide. **p 0.005, ***p 0.0005, **** p 0.0001.

