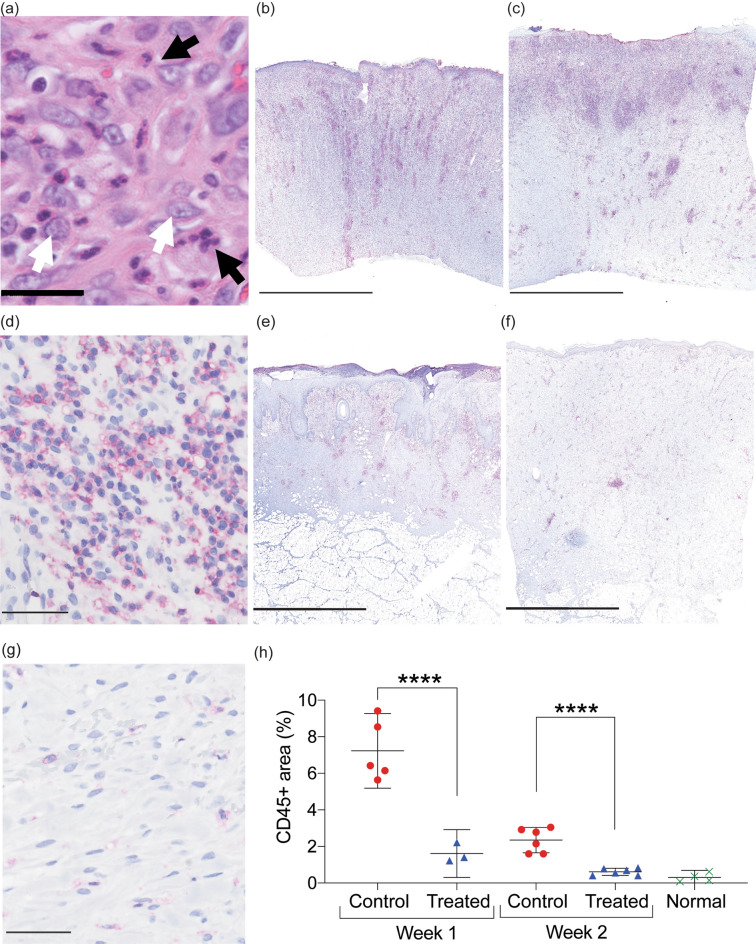
Figure 5.
Attenuation of inflammatory response in wounds treated with MSTCs. (a) H&E staining showing inflammatory infiltrate in control wounds, with high densities of neutrophils and macrophages (identifiable by their characteristic polymorphic and euchromatic nuclei, respectively). Scale bar = 25 μm. (b) Whole-biopsy view of CD45 staining (red) in a control wound at 1 week. Scale bar = 2.5 mm. (c) CD45 staining of a control wound at 2 weeks. Scale bar = 2.5 mm. (d) High-power view of CD45 staining in a control wound at 2 weeks. Scale bar = 50 μm. (e) Whole-biopsy view of CD45 staining of an MSTC-treated wound 1 week. Scale bar = 2.5 mm. (f) CD45 staining of an MSTC-treated wound at 2 weeks. Scale bar = 2.5 mm. (g) High-power view of CD45 staining in an MSTC-treated wound at 2 weeks. Scale bar = 50 μm. (h) Quantitative evaluation of CD45+ areas in MSTC-treated vs. control wounds. Density of CD45+ leukocytes was significantly lower in MSTC-treated wounds compared to controls at both time points. ****p 0.0001.

