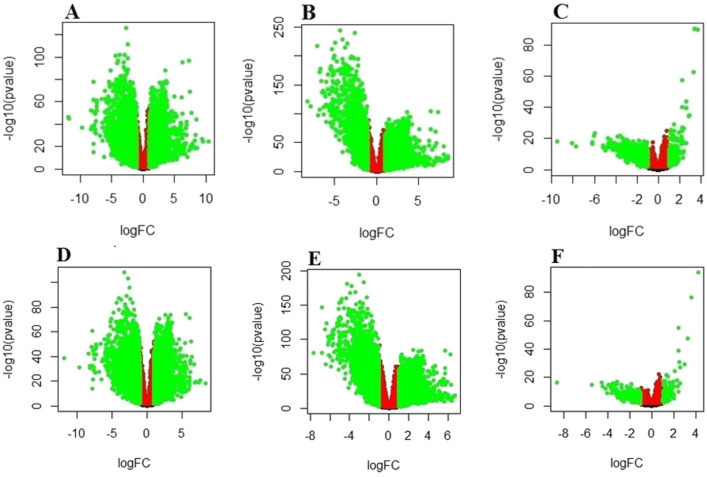
Figure 1.
Volcano plats showed analysis of differential expressed genes (DEGs) between the normal compared with the tumors (GATA3-mutant and non-mutant). (A) Log2-fold change mutant and normal; (B) non-mutant and normal; (C) non-mutant and mutant; (D) Log2-fold change mutant and normal in ER-positive patients; (E) non-mutant and normal in ER-positive patients; (F) non-mutant and mutant in ER-positive patients. Green dots represent significantly DEGs (FDR < 0.05 and log FC > 1).

