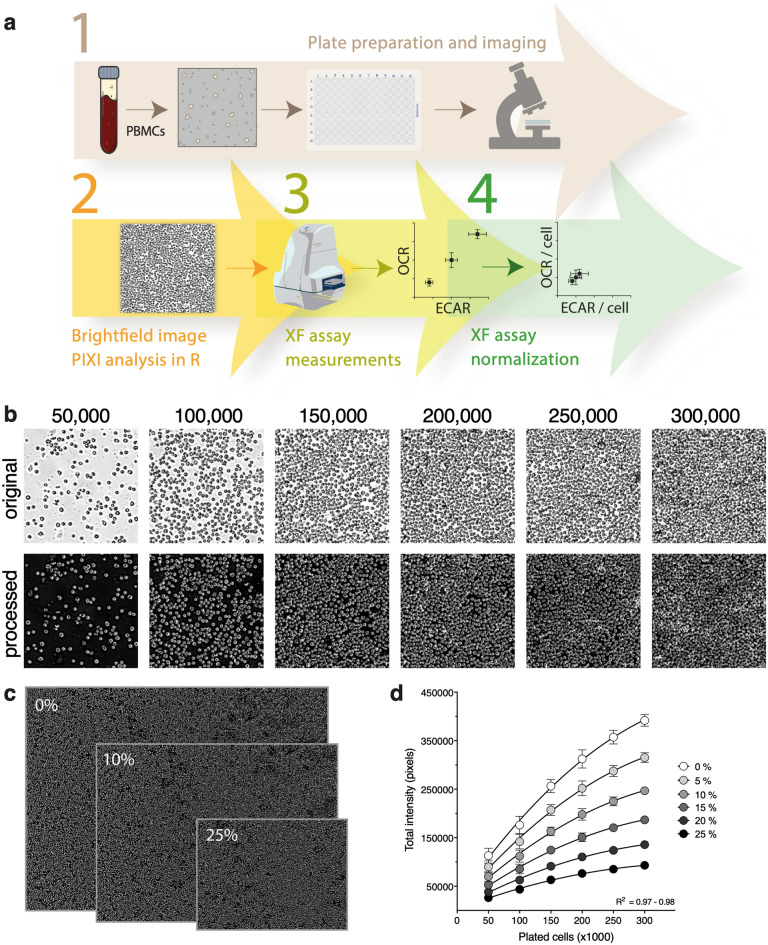
Figure 2.
R-integrated pixel intensity (PIXI) analysis from brightfield images integrated in the PBMC XF assay workflow. (a) Method workflow for PBMC XF assay data normalization using brightfield image analysis. (b) Original pre-XF assay brightfield images (top, 4 × objective) were processed using an in-house generated R script, generating images in which the total pixel intensity was quantified (bottom). A magnification from the middle of the brightfield image is shown for each seeding density (n = 14–16), for one donor. (c) Effect of 0%, 10% and 25% image border cropping on the size of the processed image at a seeding density of 200,000 cells/well. Images have the same scale bar. (d) Effect of border cropping percentage (0–25%) on the curve fit of plated cells versus total pixel intensity values.

