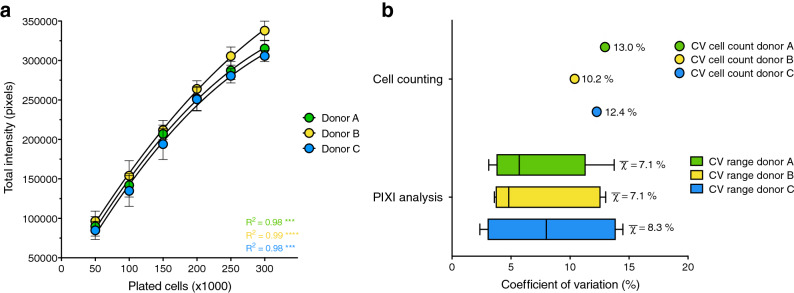
Figure 3.
R-integrated pixel intensity (PIXI) analysis from brightfield images as a reproducible image analysis tool. (a) Curve fit of the number of plated cells (50–300 × 103 cells/well, n = 14–16) versus total brightfield pixel intensity values, indicated by Pearson correlation coefficients (R2). Data is represented as mean ± s.d.. Calibration curves were used to transform total pixel intensity values back into cell numbers using second-order polynomial regression analysis. (b) Coefficients of variation (CV in %) within each donor for the cell counts of the total PBMC pool before seeding (n = 8, represented as mean) and the brightfield image PIXI analysis (represented as median ± range; means are visualized by χ-bar).

