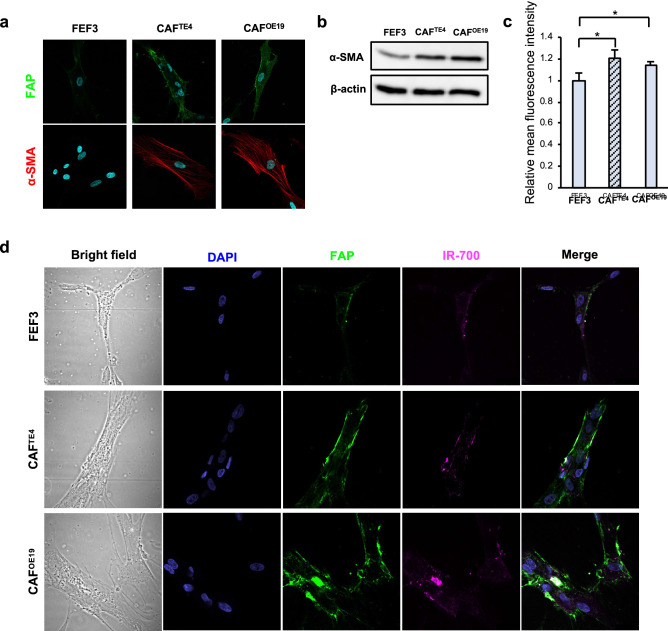
Figure 4.
FAP expression in CAFs and conjugation of FAP-IR700. (a) Immunofluorescence imaging of fibroblasts is shown. Normal FEF3 cells did not express FAP or αSMA, while CAFs stimulated with tumor cells expressed FAP on the cell surface and αSMA in the cytoplasm. Images are shown at 600 × magnification (green: FAP, red: αSMA, blue: nucleus). (b) WB demonstrated that the expression of αSMA was increased in CAFs compared to untreated FEF3 cells. (c) Flow cytometry demonstrated the expression of FAP. The relative mean fluorescence intensity of FAP was significantly increased in CAFs compared to untreated FEF3 cells as found by our FlowJo Software. Data are shown as the mean ± SD, Student’s t test. **P < 0.05. (d) The binding of FAP on CAFs and FAP-IR700 is shown by immunofluorescence imaging. After 6 h of conjugation with FAP-IR700, fibroblasts were fixed and observed by confocal microscopy. IR700 was observed in the same location as FAP expression in CAFs. However, it was not observed in normal FEF3 cells. Images are shown at 600 × magnification (green: FAP, blue: nucleus, magenta: IR700).

