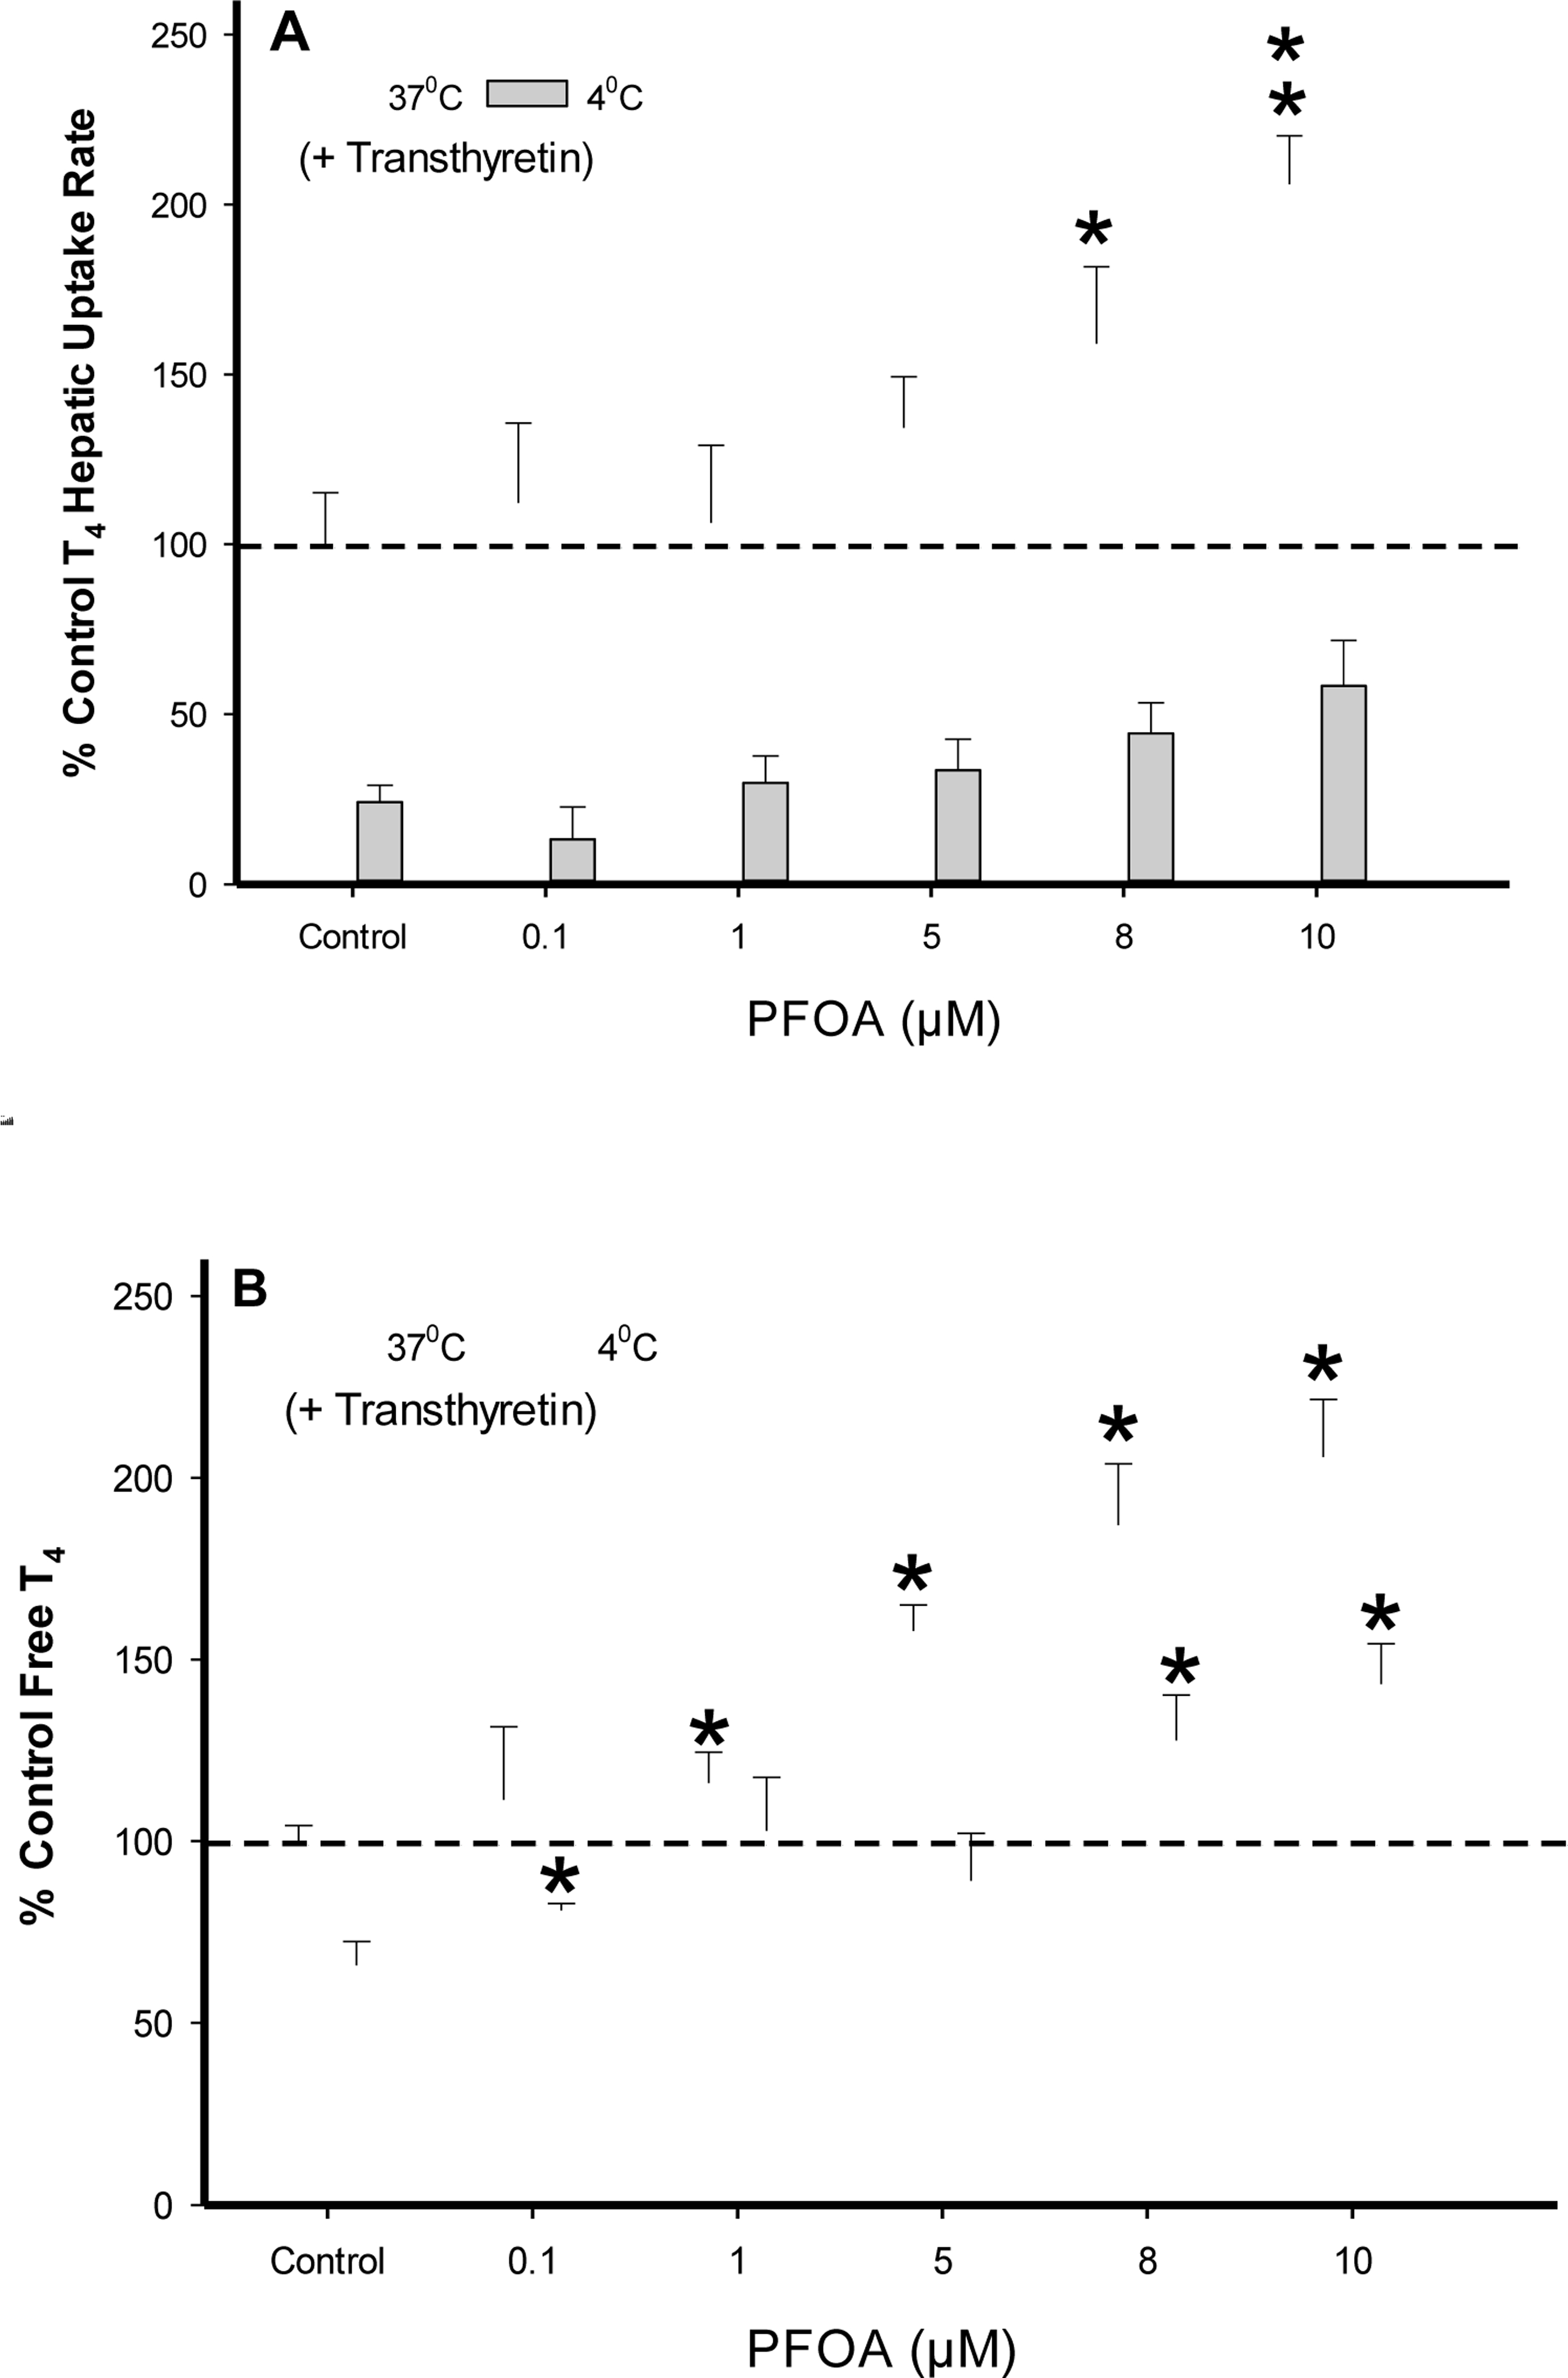
FIG. 6.

(A) Percent difference from 37°C control of T4 (1.0 μM) uptake in cryopreserved rat hepatocyte suspension treated with varying PFOA concentrations containing the serum protein transthyretin (62.5 μg/mL). Data represent the linear rate of T4 hepatic uptake (pmoles/106 cells/sec) determined from individual timelines conducted in triplicate within a single experiment. Error bars represent ± SD, asterisks denote statistically significant differences versus temperature control regression slopes (*p<0.05, **p<0.01). (B) Percent difference from 37°C control of free T4 (1.0 μM) levels in the presence of (62.5 μg/mL) transthyretin determined by 10kDa filtration of running buffer solutions (no hepatocytes). Error bars represent ± SD, asterisks denote statistically significant differences versus the temperature control (*p<0.05).
