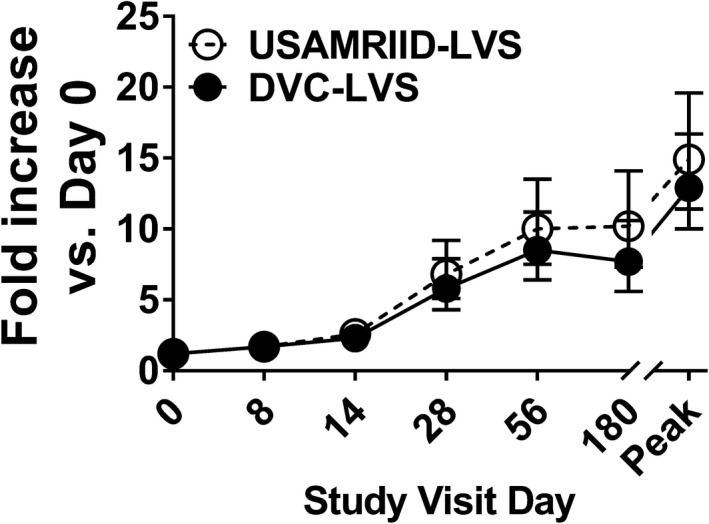
Figure 1.

No evidence of differences between proliferation magnitude rates by treatment group. Cells from 228 subjects at six time points (days 0, 8, 14, 28, 56 and 180) were stimulated with Schu‐S4. After 6 days of stimulation, cells were harvested, and cell proliferation determined by [3H]‐thymidine incorporation. Symbols and error bars represent the geometric mean of the fold increase with 95% confidence intervals. Peak, peak fold increase as defined by the maximum fold increase among all the available measures on time points post‐vaccination. Per‐Protocol Population. Data are representative of 66 independent experiments with 4 replicates.
